


NZD/USD Technical ANALYSIS: BEARISH
- NZ Dollar bounces as expected but gains might be cut short
- Indecision, early signs of topping might precede a downturn
- Break of initial support may open the way to test below 0.63
Get help building confidence in your NZD/USD strategy with our free trading guide!
The New Zealand Dollar pushed higher against its US namesake after completing a bullish Head and Shoulders (H&S) chart pattern, as expected. The pair is now testing resistance in the 0.6425-41 area, with a daily close above that exposing former support in the 0.6482-96 zone.
The H&S setup implies extension upward to challenge the latter barrier but sign of indecision have emerged to cast doubt on continued follow-through. The appearance of a Shooting Star candlestick pattern at resistance warns that buyers might be losing their resolve.
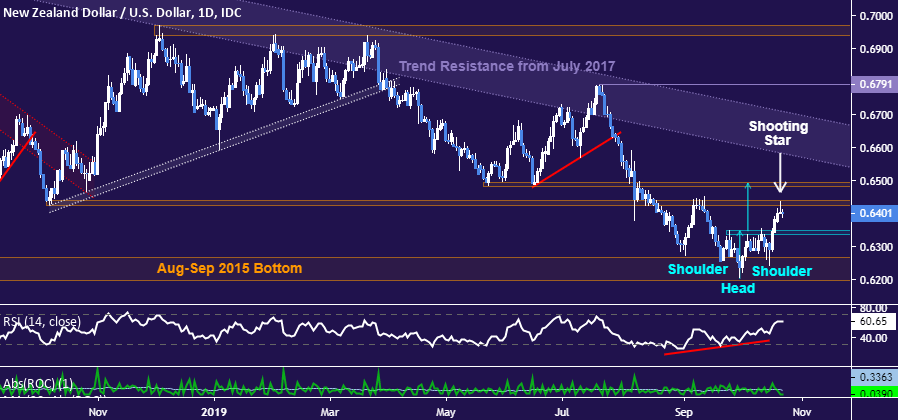
Daily NZD/USD chart created using TradingView
Zooming in to the four-hour chart seems to reinforce the possibility of a downturn. Prices broke support guiding their week-long upswing while forming a Bearish Engulfing candlestick pattern, which often signals topping. Negative RSI divergence bolsters the case for a downside scenario.
In fact, the pair might be carving out a smaller-scale H&S top with neckline at 0.6398. If confirmed, the setup would initially call for a pullback to challenge resistance-turned-support in the 0.6338-54 area. Falling back below might clear the way to probe back under the 0.63 figure.

4-hour NZD/USD chart created using TradingView
NZD/USD TRADING RESOURCES:
- Just getting started? See our beginners’ guide for FX traders
- Having trouble with your strategy? Here’s the #1 mistake that traders make
- Join a free live webinar and have your trading questions answered
--- Written by Ilya Spivak, Currency Strategist for DailyFX.com
To contact Ilya, use the Comments section below or @IlyaSpivak on Twitter


