


New Zealand Dollar Technical Analysis Talking Points:
- NZD/USD is down to lows not seen since the financial crisis
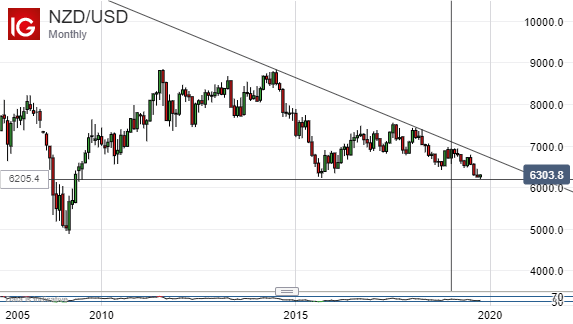
- Downtrends look solid on both the daily and monthly charts
- Bulls might step back in if risk appetite revives but they’re unlikely to break those trends
Find out what retail foreign exchange investors make of the New Zealand Dollar’s chances right now at the DailyFX Sentiment Page
The New Zealand Dollar is close to its lowest point for ten years against its big US brother as fundamental factors both foreign and domestic conspire against it.
As a growth sensitive currency, global trade fears and worries about widespread economic slowdown weigh heavily on it. Closer to home, record-low New Zealand interest rates and the worrying news that these have had little effect on chronically weak business confidence, don’t exactly add to the currency’s allure.
Technically, NZD/USD remains clearly under the influence of the long-term downtrend which has been in place since it topped out at its post-crisis peak on July 2014.
The pair’s daily chart makes scarcely better reading for the bulls. There, NZD/USD remains firmly in the grip of a downtrend channel which has bound the market since August 7 and which, in any case, is merely a more gently sloping path than the sharper fall from July’s highs which preceded it.

This week’s notable low, October 1’s fall to US$62.05 may have taken the Kiwi down to lows not seen since April 2009, but recent price action shows a succession of lower highs which strongly suggests that the currency will go lower yet.
Bulls might get themselves out of jail to some extent if they can meaningfully top the previous chart peak September 25’s 63.42. If they can get comfortable there, then September 12’s one-month top of 64.44 might be attainable but that looks like a very big ask given that any gains are likely to be mere staging posts on the road lower.
There may be some near-term support in the 63.36 area which limited the bears on a daily closing basis earlier this week, ahead of that intraday low of October 1. Below that, however, channel support in the 61.69 region would be in play. This channel has not endured many downside tests and may prove rather fragile if the market forces one.
New Zealand Dollar Resources for Traders
Whether you’re new to trading or an old hand DailyFX has plenty of resources to help you. There’s our trading sentiment indicator which shows you live how IG clients are positioned right now. We also hold educational and analytical webinars and offer trading guides, with one specifically aimed at those new to foreign exchange markets. There’s also a Bitcoin guide. Be sure to make the most of them all. They were written by our seasoned trading experts and they’re all free.
--- Written by David Cottle, DailyFX Research
Follow David on Twitter @DavidCottleFX or use the Comments section below to get in touch!


