NZD/USD Technical ANALYSIS: BEARISH
- New Zealand Dollar testing three-year lows against US counterpart
- Break of support may set the stage for weakness into the 0.62 figure
- NZD/USD on the verge of breaking near-two-decade trend support
Get help building confidence in your NZD/USD strategy with our free trading guide!
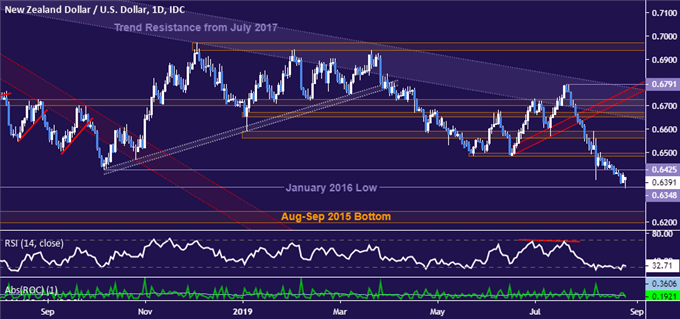
The New Zealand Dollar sank to challenge the January 2016 low at 0.6348 against its US counterpart after clearing the October 2018 bottom at 0.6425, as expected. A further downward push sees the next major layer of support marked by four-year lows in the 0.6197-0.6245 area.
Alternatively, a rebound back above 0.6425 – now recast as resistance – sets the stage for a retest of the recently broken support shelf in the 0.6482-96 zone. Invalidating the overall bearish bias would require far steeper gains however: dominant trend resistance now hovers just below 0.68.

NZD/USD daily chart created using TradingView
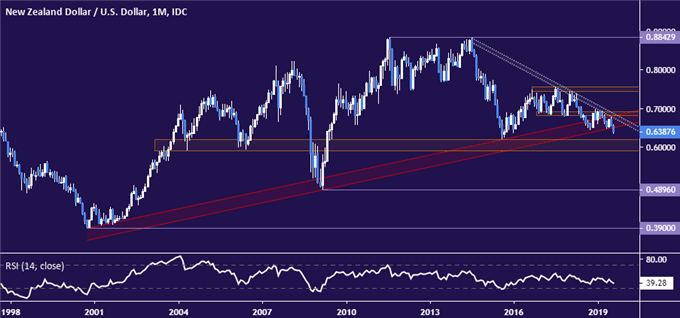
Zooming out to the monthly chart, the latest downturn brings prices closer to confirming a break of support defining the NZD/USD uptrend for nearly two decades. Finishing August underneath it – a prospect now just a week away – would mark a major regime change and expose the 0.5914-0.6197 region.

NZD/USD monthly chart created using TradingView
NZD/USD TRADING RESOURCES:
- Just getting started? See our beginners’ guide for FX traders
- Having trouble with your strategy? Here’s the #1 mistake that traders make
- Join a free live webinar and have your trading questions answered
--- Written by Ilya Spivak, Currency Strategist for DailyFX.com
To contact Ilya, use the Comments section below or @IlyaSpivak on Twitter


