


NZD/USD Technical ANALYSIS: NEUTRAL
- NZD/USD countertrend support break hints 2-year down move back in play
- Near-term setup hints immediate selling pressure has given way to indecision
- RBNZ-inspired volatility may trigger breakout defining long-term price trend
Join the live RBNZ rate decision webinar to see how it impacts the price chart setup!
A break of counter-trend support guiding the New Zealand Dollar higher since mid-June suggests the dominant downtrend established from July 2017 has resumed. Sellers have challenged support in the 0.6482-96 area, with a daily close below that opening the door for a test of the October 2018 low at 0.6425.
Immediate resistance is in the 0.6559-91 congestion region. A break back above that eyes a dense layer of back-to-back support levels running up from 0.6653 through 0.6727. Beyond that, the dominant downtrend top intersects with the July swing top at 0.6791, making for a bias-defining barrier.

NZD/USD daily chart created using TradingView
Zooming in to a four-hour chart, it seems prices have breached the bounds of the near-term downswing, settling into a congestion range. Indecision and proximity to support might discourage sellers on risk/reward grounds in the near term, putting the spotlight on the looming RBNZ rate decision for a possible catalyst.
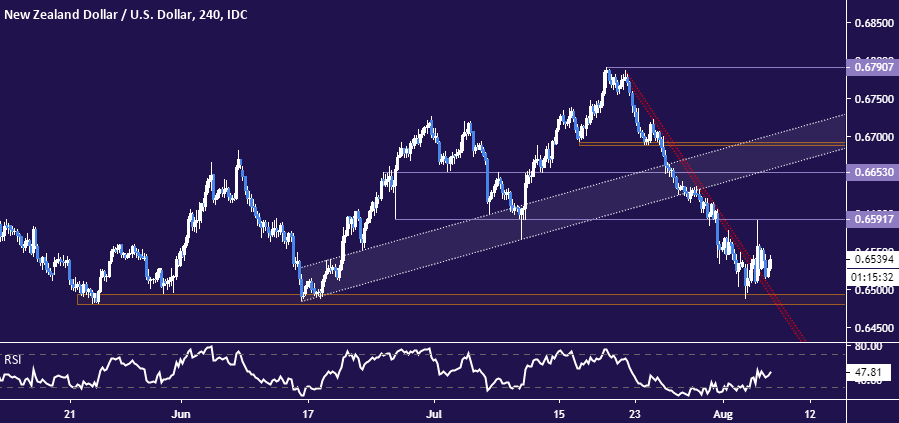
NZD/USD 4-hour chart created using TradingView
The announcement might spur on a critical breakout, regardless of direction. The monthly chart reveals NZD/USD is wedged between resistance guiding them lower since mid-2014 and 19-year uptrend support. A meaningful price swing one way or the other might define direction for months and years to come.
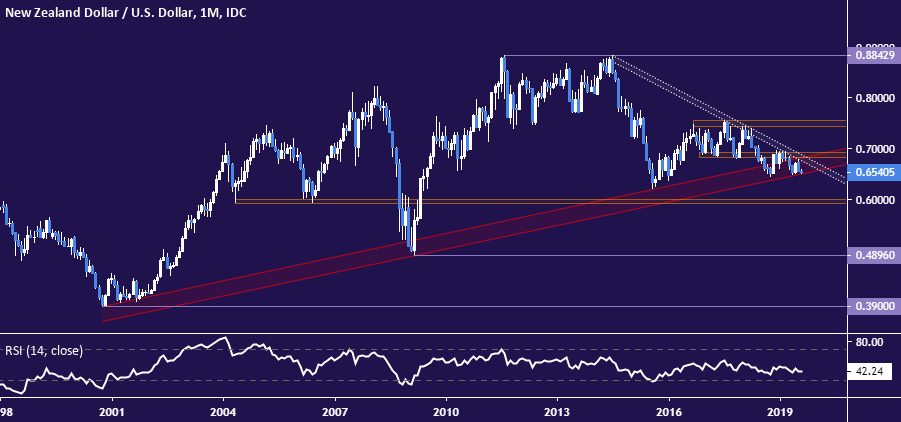
NZD/USD monthly chart created using TradingView
NZD/USD TRADING RESOURCES:
- Just getting started? See our beginners’ guide for FX traders
- Having trouble with your strategy? Here’s the #1 mistake that traders make
- Join a free live webinar and have your trading questions answered
--- Written by Ilya Spivak, Currency Strategist for DailyFX.com
To contact Ilya, use the Comments section below or @IlyaSpivak on Twitter


