


NZD/USD Technical Strategy: FLAT
- NZ Dollar on the cusp of the worst losing streak in nearly 3 years
- Daily, 4-hour chart hint a corrective bounce may be in the works
- Looking for recovery to yield an opening to enter short position
The New Zealand Dollar is on the cusp of the worst losing streak in nearly three years but a corrective bounce may precede further weakness. Prices have fallen for eight consecutive to meet support at 0.7049, the 50% Fibonacci expansion. A daily close below that exposes the 61.8% level at 0.6957.

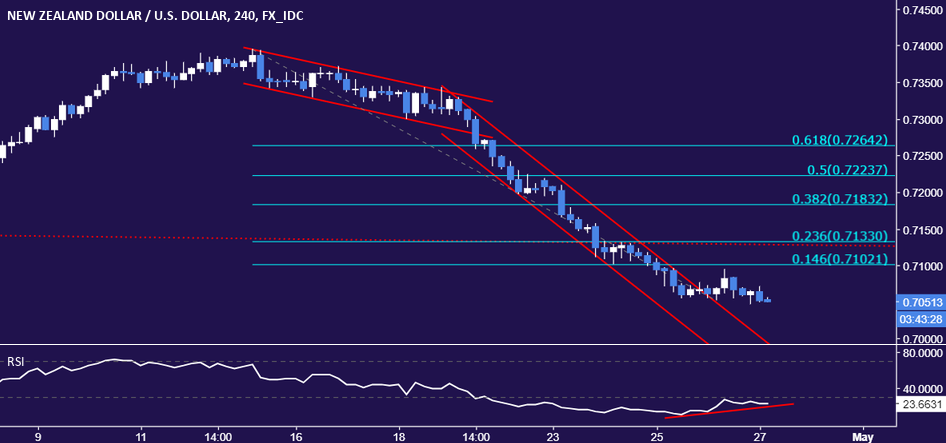
An inverted Hammer candlestick above this barrier warns of indecision and a look at shorter-term positioning reinforces the case for a bounce. The four-hour chart reveals positive RSI divergence as prices drift below the 0.71 figure, hinting at ebbing downside momentum that may precede a corrective upswing.
With that in mind, opting to wait for a bounce to look for selling opportunities seems prudent. Back on the daily chart, the first layer of significant resistance comes in at 0.7140 (38.2% Fib, channel floor), followed by the 23.6% expansion at 0.7254.
NZD/USD TRADING RESOURCES
- Just getting started? See our beginners’ guide for FX traders
- Having trouble with your strategy? Here’s the #1 mistake that traders make
- Join a free Trading Q&A webinar and have your questions answered
--- Written by Ilya Spivak, Currency Strategist for DailyFX.com
To contact Ilya, use the Comments section below or @IlyaSpivak on Twitter
To receive Ilya's analysis directly via email, please SIGN UP HERE


