To receive Ilya's analysis directly via email, please SIGN UP HERE
Talking Points:
- NZD/USD Technical Strategy: Flat
- Kiwi Dollar continues to tread water near 0.73 vs. US counterpart
- Negative RSI divergence hints at topping but confirmation is absent
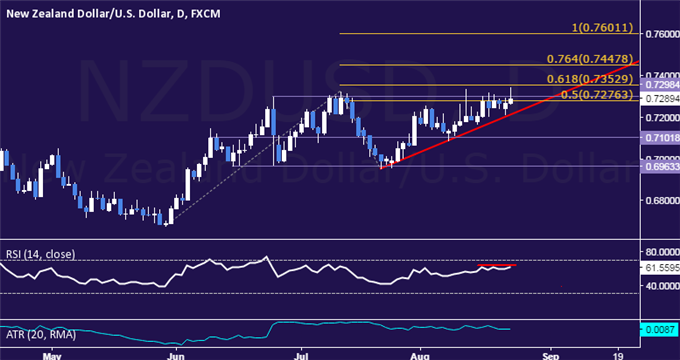
The New Zealand Dollar continues to tread water in a narrow range against its US namesake having repeatedly failed to hold up above the 0.73 figure. Emerging negative RSI divergence hints at ebbing upside momentum and may be signaling a downward reversal on the horizon.
Near-term rising trend line support is now at 0.7225, with a break below that opening the door for a test of a horizontal pivot level at 0.7102. Alternatively, a daily close above the June 24 high at 0.7298 paves the way for a challenge of the 61.8% Fibonacci expansion at 0.7353.
Positioning is inconclusive at this point. While early downside reversal cues appear to be emerging, a clear-cut reversal signal is conspicuously absent. Furthermore, prices are wedged too tightly between immediate support and resistance to justify a trade from a risk/reward perspective. Opting for the sidelines seems prudent.
What do past NZD/USD price patterns hint about current trends? Find out here !