


To receive Ilya's analysis directly via email, please SIGN UP HERE
Talking Points:
- NZD/USD Technical Strategy: Flat
- Support: 0.7492, 0.7429, 0.7366
- Resistance:0.7570, 0.7641, 0.7696
The New Zealand Dollar declined as expected after producing a bearish Evening Star candlestick pattern. A daily close below the 38.2% Fibonacci retracement at 0.7492 exposes the 50% level at 0.7429.Alternatively, a turn above the 23.6% Fib at 0.7570 clears the way for a challenge of falling trend line resistance at 0.7641.
Prices are wedged too closely between near-term support and resistance levels to justify taking a trade on a long or short side from a risk/reward perspective. With that in mind, we will continue to stand aside until a more attractive opportunity presents itself.
Add these technical levels directly to your charts with our Support/Resistance Wizard app!
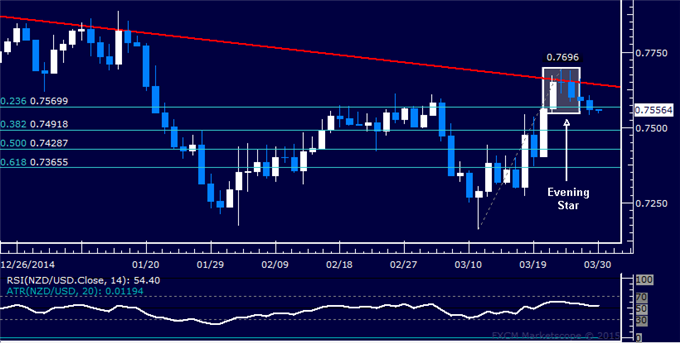
Daily Chart - Created Using FXCM Marketscope
--- Written by Ilya Spivak, Currency Strategist for DailyFX.com


