


Talking Points:
- Nikkei 225 Strategy: Patiently wait for breach of resistance; range trade
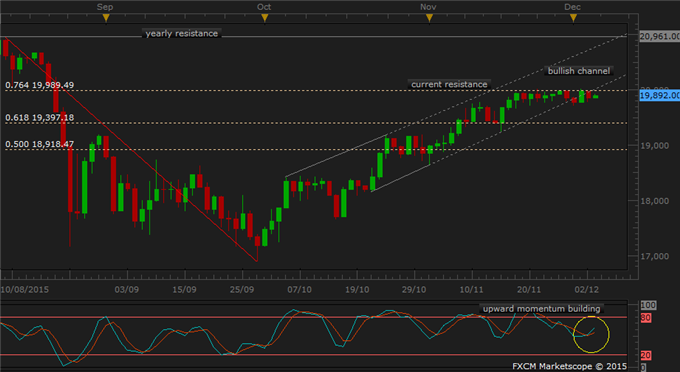
- Slight upward momentum retains the upside of the index
- Strong resistance of 76.4% Fibonacci at 19,989.4. Firm support of 61.8% Fibonacci at 19,397.1
The Nikkei 225 is struggling to break above the 19,989.4 resistance level and 76.4% Fibonacci. Upward momentum is building in the daily chart, an early good sign for the bulls. The October-November bullish channel is beckoning the index, if it manages to break above.
Nikkei has traded flat underneath resistance level since November 18. As a result, it broke through the lower bound of bullish channel (and a previous support trend line). If momentum is to indicate price action, it may return to the channel following a resistance breach.
Clearly all eyes are on the upside at present, although patience may be stretched thin for the bulls. Range traders could also watch out for any reversal from here down to 61.8% Fibonacci and support level at 19,397.1. Tight stops should be placed on any trades that go against the direction of momentum.
Losing Money Trading Forex? This Might Be Why.


