Nikkei 225 Technical Analysis Talking Points:
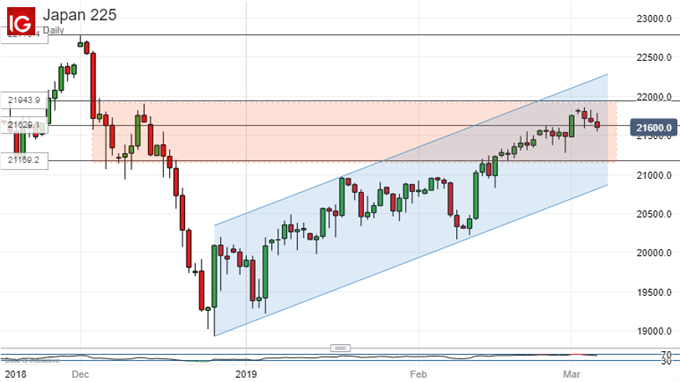
- The Nikkei 225’s dominant uptrend channel is still with us
- But within it the index seems to have failed to top an important daily-chart range
- The bulls will need to remedy this soon
Get trading hints and join our analysts for interactive live coverage of all major economic data at the DailyFX Webinars.
The Nikkei 225 remains well within its long-dominant uptrend channel but, all the same signs of technical weakness are starting to emerge which probably shouldn’t be ignored, at least as short-term cues.
Within that uptrend the Tokyo equity benchmark seems to have topped out this week well short of the top of a trading range between 21,169 and 21,934. That last bounded trade between Dec 3 and 17, before the long dive which took the index down to this year’s lows so far.
Much of that slide has been recovered, but the process seems to have stalled, at least for the present although, for as long as that uptrend is still in place, revival is always likely.

That said much may now depend on how far down retracement will take the index. If the process halts around near-term support from last week in the 21,542 area then the bulls may find themselves with little to worry about.
If on the other hand the index falls further, perhaps back toward the psychologically important 21,000 handle then the uptrend channel could come under threat as it has not since its lower boundary was last tried back on February 11.
It proved resilient on that occasion and may do again. For now those bulls can probably take some comfort from the fact that the channel bottom is some way below the market, in the 20,821 area.
If the rally can get back on track and manage to hold the index above that former trading range, then November 17’s peak of 22,747 will be the most obvious upside target. That looks like a big ask for the bulls though, and progress toward it will probably be quite sedate. The index has retreated somewhat from its most recent overbought levels but, all the same, could do with cooling down a little further.
Resources for Traders
Whether you’re new to trading or an old hand DailyFX has plenty of resources to help you. There’s our trading sentiment indicator which shows you live how IG clients are positioned right now. We also hold educational and analytical webinars and offer trading guides, with one specifically aimed at those new to foreign exchange markets. There’s also a Bitcoin guide. Be sure to make the most of them all. They were written by our seasoned trading experts and they’re all free.
--- Written by David Cottle, DailyFX Research
Follow David on Twitter @DavidCottleFX or use the Comments section below to get in touch!


