


Nikkei 225 Technical Analysis Talking Points:
- The Japanese stock benchmark has risen consistently this year
- Some pause for consolidation is only to be expected
- However key supports are quite nearby
Get trading hints and join our analysts for interactive live coverage of all major economic data at the DailyFX Webinars.
The Nikkei 225 is exhibiting a pattern rather common to developed market equity right now.
Just as with Australia’s ASX 200, the Japanese benchmark remains well within its dominant daily-chart uptrend channel and has made its way into an old trading range from 2018. However, it is showing some signs of exhaustion and may need a period of consolidation before it can push on.
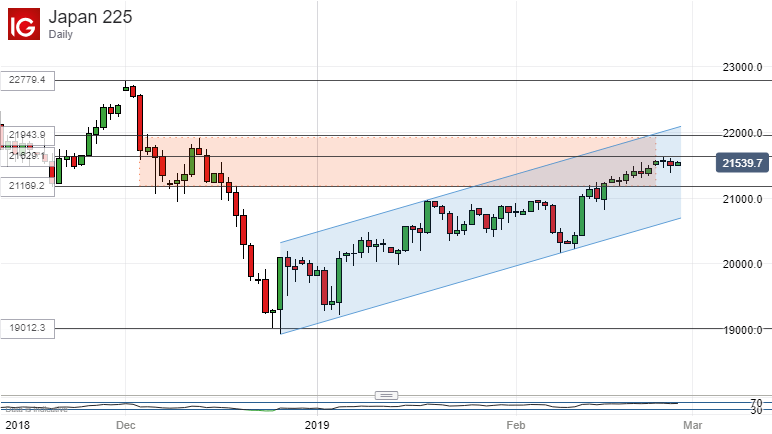
The range in question comes in between 21,943 and 21,169. That range formed a brief pause on what turned out to be the road lower towards the end of 2018. The bulls need to top it convincingly if they are to take a stab at the previous significant high -December 2’s 22,847.
However, at present the index seems to be topping out around the 21,629 level. The last couple of weeks have been replete with the sort of narrow daily ranges which might suggest a bit of investor indecision.
Still, momentum indicators have risen only gradually and do not at this point claim the index as overbought.
The question now, then, is whether the index can consolidate around current levels, in which case it could push higher, or whether it will retrace more seriously. Fundamental risk appetite is likely to dictate this, with investors looking keenly to trade headlines from either Washington or Beijing following this week’s evidence that negotiations are going well.
Near-term technical signals could involve the range base at 21.169, and the upward channel base further below it at 20,500 or so. As long as any slips are confined to the region between these two levels then the ‘consolidation’ story will look plausible and further upside may then follow, whether or not it can top that December high.
A slide below both, however, would probably put market focus on the psychologically important support level of 20,000. The index fell below this only briefly at the turn of last year. Before that it had held since April, 2017.
Resources for Traders
Whether you’re new to trading or an old hand DailyFX has plenty of resources to help you. There’s our trading sentiment indicator which shows you live how IG clients are positioned right now. We also hold educational and analytical webinars and offer trading guides, with one specifically aimed at those new to foreign exchange markets. There’s also a Bitcoin guide. Be sure to make the most of them all. They were written by our seasoned trading experts and they’re all free.
--- Written by David Cottle, DailyFX Research
Follow David on Twitter @DavidCottleFX or use the Comments section below to get in touch!


