


Nikkei 225 Technical Analysis Talking Points:
- The Tokyo stock benchmark has risen into 2019
- However, it has yet to make back the big falls seen in December
- If it can’t then focus will be back to the downside
Get trading hints and join our analysts for interactive live coverage of all major economic data at the DailyFX Webinars.
The Nikkei 225 has inched up through January but the move has yet to show much conviction.
Indeed young 2019 has been full of trading days on which the daily close has not been far from the opening point, with the full intraday range much wider. This sort of pattern can indicate periods of indecision but, with the year still young, it could just indicate that trading desks remain short of full staffing.
If so next week might bring more reliable directional clues. The bulls’ first tactical order of business must be to claw back the steep series of daily falls seen between December 17 and 24. So far the Nikkei had made back just a little under half of that slide and already appears to be topping out.
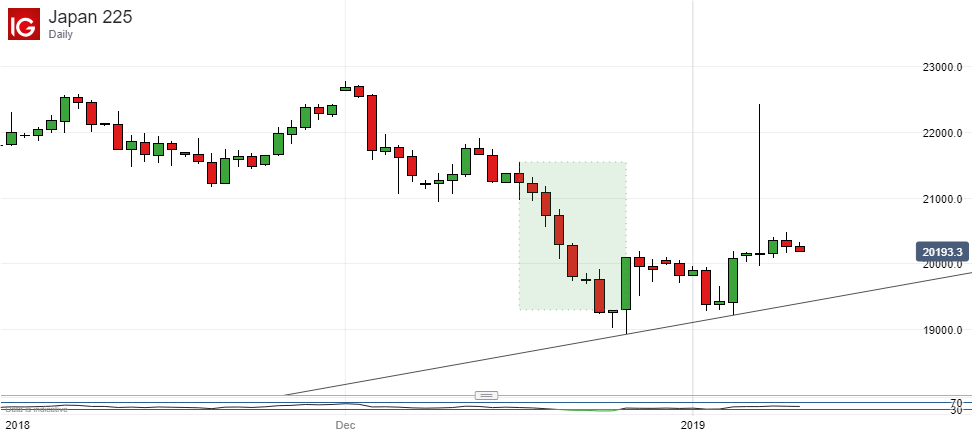
If it proves to be doing that, confirmed by a weekly close, then trendline support will come into focus. For now that remains some way below the market, in the 19,4000 region. However, if the trendline fails to hold then the benchmark could be in for deeper falls yet.
On its monthly chart the Nikkei is at an interesting juncture right about now, if not a comfortable one.

As you can see it is flirting with support within a channel which has marked the secular uptrend from June 2012. Moreover, given that the index essentially went nowhere between 2009 and its liftoff in 2012, it could be said that the channel above really marks the Nikkei’s post-financial-crisis recovery.
With this in mind the next few months’ closing levels will bear very careful watching. A decisive downside break of this channel need not be immediately catastrophic for the bulls, indeed it very probably won’t be. But it should give them pause all the same.
Resources for Traders
Whether you’re new to trading or an old hand DailyFX has plenty of resources to help you. There’s our trading sentiment indicator which shows you live how IG clients are positioned right now. We also hold educational and analytical webinars and offer trading guides, with one specifically aimed at those new to foreign exchange markets. There’s also a Bitcoin guide. Be sure to make the most of them all. They were written by our seasoned trading experts and they’re all free.
--- Written by David Cottle, DailyFX Research
Follow David on Twitter @DavidCottleFX or use the Comments section below to get in touch!


