


Nikkei 225 Technical Analysis Talking Points:
- The Nikkei 225 has made a new low for 2018 this week
- That now puts focus on support between current levels and the last significant lower points, hit in April, 2017
- As long as that support zone holds, bulls can keep hoping
Get trading hints and join our analysts for interactive live coverage of all major economic data at the DailyFX Webinars.
The Nikkei 225 provides a good example of the volatility seen across developed-market equity in the past week, in which it has made new lows for the year and pushed sharply higher from them.
Of course such roller-coaster rides are hardly unknown as a year’s trading winds down, but the end of this year has been rather special, as Wednesday’s record one-day gains for US stocks attest. Still, caution is obviously warranted at least until more normal trading conditions resume in early January.
For now, the Nikkei has traded well under a formerly important support zone seen in red on the chart below. This came in between October’s lows and the lows of mid-December, and it is only worth mentioning because the bulls seem to retain some hope that they can get the index back into it.
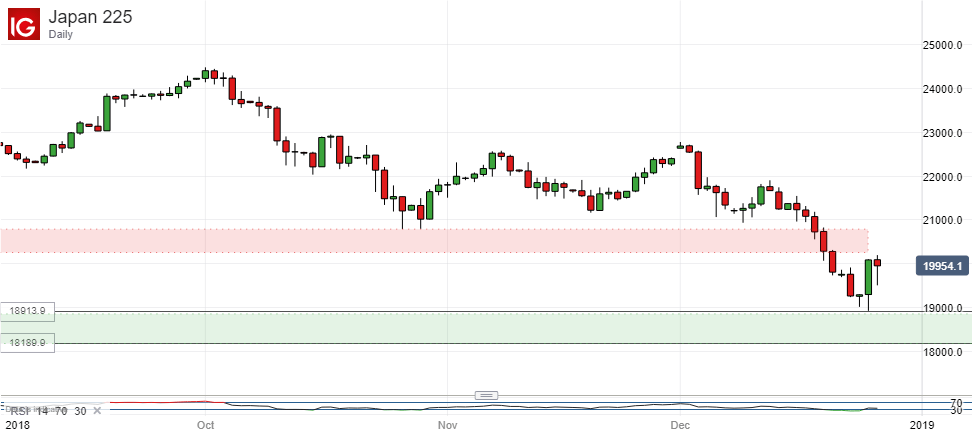
While the ‘green resistance zone holds, they may not give up hope. It is composed of the space between this year’s new low and the next notable nadir which is 18,190- the low of April 15, 2017. Should that support give way then the index would clearly be in deeper trouble from a bullish perspective with the psychologically important 18,000 level then in some jeopardy.
However if the bulls can hold the line and trade back into that former support zone, then mid-December’s peak of 21,876 could beckon again. This looks like a very big ask at present, however.
There is some evidence that the index could be close to a long-term peak. On its monthly chart the Nikkei looks set to challenge an uptrend line which has previously held good since July, 2012.
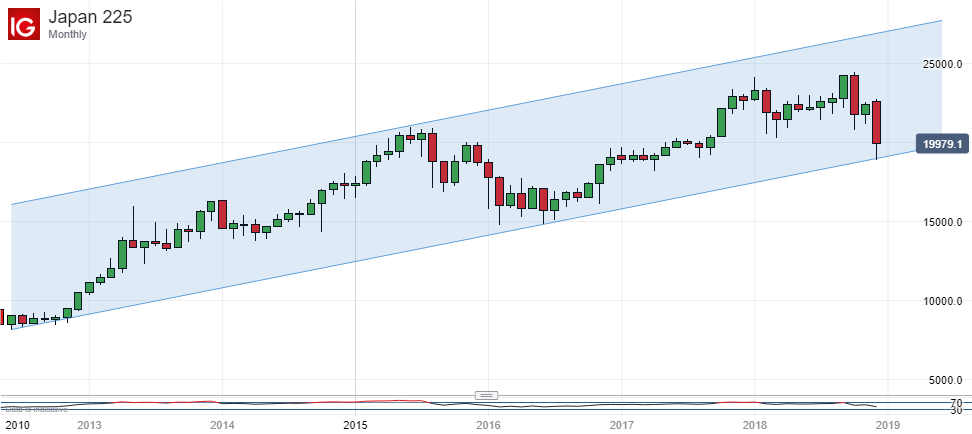
A break below this might well mark a significant shift in sentiment and could put mid-2017’s action in the 18,500 region in focus quite quickly.
Resources for Traders
Whether you’re new to trading or an old hand DailyFX has plenty of resources to help you. There’s our trading sentiment indicator which shows you live how IG clients are positioned right now. We also hold educational and analytical webinars and offer trading guides, with one specifically aimed at those new to foreign exchange markets. There’s also a Bitcoin guide. Be sure to make the most of them all. They were written by our seasoned trading experts and they’re all free.
--- Written by David Cottle, DailyFX Research
Follow David on Twitter @DavidCottleFX or use the Comments section below to get in touch!


