


Nikkei 225 Technical Analysis Talking Points:
- The Nikkei 225 remains under some bear pressure
- There’s little sign of a sustainable fightback at current levels
- A key support zone is getting close
Get trading hints and join our analysts for interactive live coverage of all major economic data at the DailyFX Webinars.
The Nikkei 225’s daily technical chart looks a little worrying for the bulls at this point. The Tokyo blue-chip benchmark broke below its dominant uptrend channel at the end of last week and has faded further away from it in the sessions since.
Fundamentally speaking this down-move has been far from unique to the Nikkei. A new wave of risk aversion has rippled across the world’s financial markets. Trade worries, collapsing oil prices, growth fears and jitters in Europe related to both Brexit and Italy’s budgetary standoff with the European Union were never going to make a very equity-supportive cocktail.
Technically the Nikkei’s bounce faded out on in the 22,540 region last Wednesday, well short of the previous significant peak. That was the 22,950 hit on October 17. Had the bulls been able to retake that region and hang on, they might now be considering another crack at this year’s multi-decade peak of 24,467 reached on October 1.
As it is, they could rather be faced with a trip back to the year’s lows.
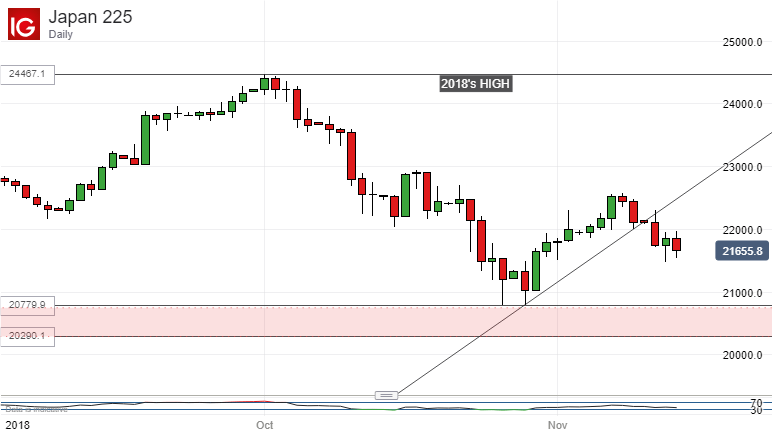
For now a broad band of support between the intraday lows of last month and the nadir of late March at 20,290 guards them. It’s the red zone you can on the chart above.
If the index can build some kind of base between current levels and that range top, then perhaps the bulls can hope to regain control of events. If however the index slips back into that support zone then a trial of its base is probably only a matter of time.
The first likely upside target comes in at 22,588. That is now the most recent significant high, printed last week. However getting even back to that looks like a big ask given current risk appetite and more downside toward that support zone looks more likely, whether or not it gets there particularly quickly.
Watch Thursday’s close carefully. Another ‘lower low’ would make it five out of the past six sessions- a discouraging sign.
Resources for Traders
Whether you’re new to trading or an old hand DailyFX has plenty of resources to help you. There’s our trading sentiment indicator which shows you live how IG clients are positioned right now. We also hold educational and analytical webinars and offer trading guides, with one specifically aimed at those new to foreign exchange markets. There’s also a Bitcoin guide. Be sure to make the most of them all. They were written by our seasoned trading experts and they’re all free.
--- Written by David Cottle, DailyFX Research
Follow David on Twitter @DavidCottleFX or use the Comments section below to get in touch!


