Nikkei 225 Technical Analysis Talking Points:
- The Nikkei 225 remains well within a clearly defined range
- There are obvious upside and downside targets but no impetus to hit either
- It’s time to watch and wait
Get trading hints and join our analysts for interactive live coverage of all major economic data at the DailyFX Webinars.
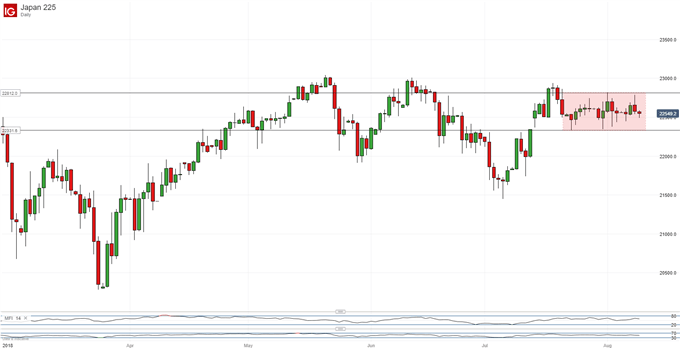
The Nikkei 225’s daily chart points to a touch of technical stasis, of the sort now quite common across the equity market space.
The Tokyo stock benchmark has settled into a broad range since late July at what- by recent standards- are quite elevated levels. While bulls can if they like take some comfort that the market is clearly in no hurry to take cash off the table, there is clearly little impetus to push on towards recent highs, which remain just out of reach.

In this respect, the Tokyo equity benchmark is behaving very like Australia’s ASX 200, for which similar patterns can be seen.
Of course, the range will break eventually but so far the Nikkei is offering chart watchers few clues as to when that day might come, or to which side it will be. As long as mid-July’s top of 22,927 remains unthreatened on a daily-closing basis we might guess that the index is probably biased lower, but that’s only a possibility.
The range is fairly broad, bounded to the downside by 22,317 and to the top by 22,830, so just playing it until it breaks offers at least some opportunity.
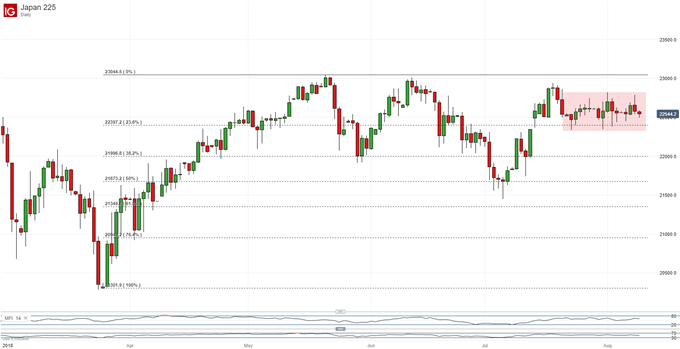
But if that mid-June top represents a plausible target for an upside range break, where might a slip through the downside find support? Well, the first, 23.6% retracement of the rise from the lows of late March to May 21’s 23,044 – a point which hasn’t been topped since- looks likely. That comes in a 23,397 and has held off the bears on a daily closing basis since July 13. Even if it fails, a cluster of likely props from late June in the 22,200 area may catch the fall.

Resources for Traders
Whether you’re new to trading or an old hand DailyFX has plenty of resources to help you. There’s our trading sentiment indicator which shows you live how IG clients are positioned right now. We also hold educational and analytical webinars and offer trading guides, with one specifically aimed at those new to foreign exchange markets. There’s also a Bitcoin guide. Be sure to make the most of them all. They were written by our seasoned trading experts and they’re all free.
--- Written by David Cottle, DailyFX Research
Follow David on Twitter @DavidCottleFX or use the Comments section below to get in touch!


