


Nikkei 225 Talking Points:
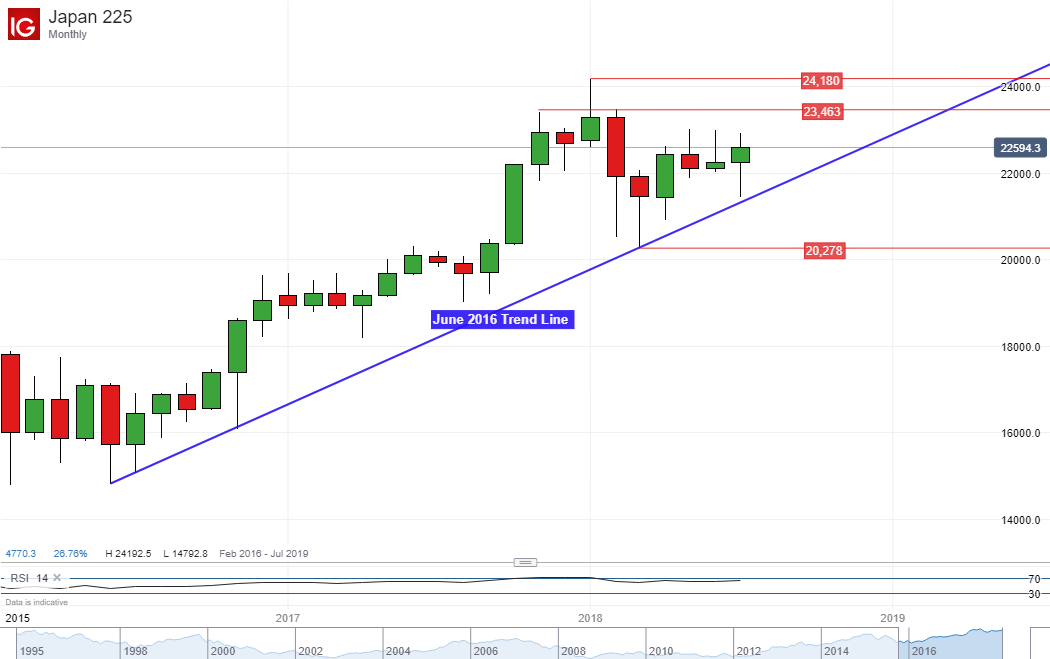
- The Nikkei 225 remains in an uptrend when looking at the monthly chart
- Near-term risk is a triple top bearish reversal pattern, rising support eyed
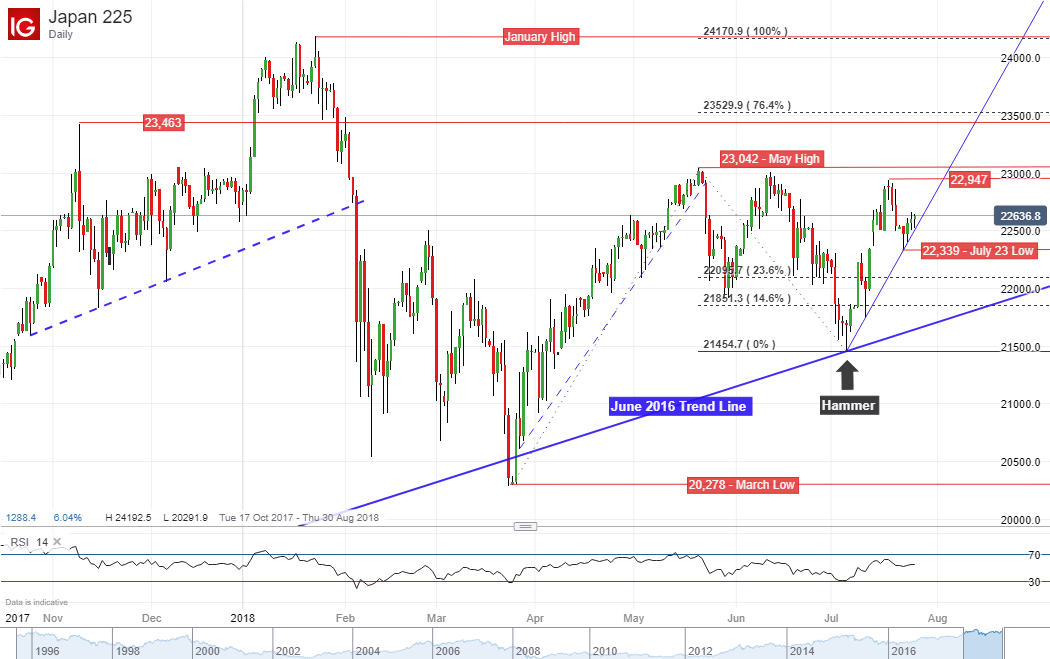
- Confirmation of a lasting reversal needs a close below 20,278, March low
Find out what equities could face in the third quarter in our most recent forecast in the DailyFX Trading Guides page
In the bigger scheme of things, the Nikkei 225 remains in an uptrend when looking at the monthly chart below. You can see it is being supported by a rising trend line dating back to June 2016. However, its progress in 2018 so far has been rather shaky. Thus far, it has been oscillating in a range between 24,180 and 20,278. For it to make its leg move higher, it does face some obstacles ahead.
Zooming in on the daily chart shows that the index is also in a near-term uptrend which began earlier this month with the formation of a hammer bullish reversal candlestick formation. Since then, the Nikkei 225 also formed a near-term rising trend line. However, the index has struggled on multiple occasions to push above the May high established at 23,042 and appears to have formed a triple top bearish reversal pattern.
A break below near-term support could thus pave the way for its next leg lower and immediately ahead is the July 23rd low at 22,339. A push below that exposes the 23.6% and 14.6% Fibonacci extensions at 22,095 and 21,851 respectively. However, for a lasting reversal and one that could perhaps end up overturning the long-term uptrend from 2016, we would need to get below the June line and then the March low at 20,278.
On the other hand, a push above resistance could pave the way for the Nikkei 225 eventually getting back to January highs around 24,170. This would also invalidate the triple top bearish reversal formation. In order to get there, it needs to push above 23,463 (November 2017 high) which is not too far off from the 76.4% Fibonacci extension (23,529).
Just getting started trading? See our beginners’ guide for FX traders to learn how you can apply this in your strategy!
Nikkei 225/Equities Trading Resources:
- Join a free Q&A webinar and have your trading questions answered
- Having trouble with your strategy? Here’s the #1 mistake that traders make
- See how equities are viewed by the trading community at the DailyFX Sentiment Page
--- Written by Daniel Dubrovsky, Junior Currency Analyst for DailyFX.com
To contact Daniel, use the comments section below or @ddubrovskyFX on Twitter


