NIKKEI 225 TECHNICAL ANALYSIS, TALKNG POINTS:
- The Nikkei 225 is clearly struggling
- The down-move seems to be solidly fundamental in nature, however
- The technical still offer some reasons to be optimistic
Get trading hints and join our analysts for interactive live coverage of all major economic data at the DailyFX Webinars.
The Nikkei 225 continues to wilt as trade-war worries and higher oil prices take some wind out of stock markets worldwide.
So much for the fundamentals. How much technical trouble the index is in is more debatable, even if the more obvious signs do not look great if you’re a bull.
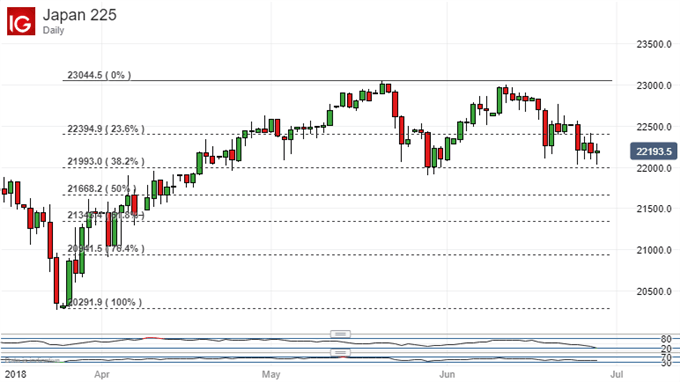
The Tokyo blue-chip benchmark has been in clear retreat ever since making its mid-June highs around 23000 in the middle of the month. Moreover, those highs themselves must count as ‘lower highs’ as they’re below the previous significant peaks which were scaled on May 21, if only by a whisker.

As if to further frighten the bulls, there would appear to be a clear danger of a double-top reversal forming on the index’s daily chart. If that is the case then all of the ground gained since the index bounced so strongly at the end of March could be in some jeopardy.
However, there could still be cause for hope. Much may depend on whether the second Fibonacci retracement of the rise up from those March lows to the peaks of late May can hold. As you can see from the chart above it comes in at 21993, which is more or less exactly where the bears were checked at the end of May.
Another test seems likely in the next few days should current trends continue. However, the index is also edging down very close to oversold territory according to its Relative Strength Index. There could be cause to hope that this key level will endure once more.
We must also bear in mind that much of the index’s current weakness seems to be down to trade-linked fundamentals, and be wary of building a technical scenario simply to fir that case. If the trade picture were calmer its is at least possible to suppose that the Nikkei would now be substantially higher, and therefore its logical to think that it may rise further should those trade worries simmer down. They may.
But for now keep a close eye on 21993. If it holds on a daily or weekly closing basis, then the double top reversal may yet be allayed. If not, then there could be significant further falls.
RESOURCES FOR TRADERS
Whether you’re new to trading or an old hand DailyFX has plenty of resources to help you. There’s our trading sentiment indicator which shows you live how IG clients are positioned right now. We also hold educational and analytical webinars and offer trading guides, with one specifically aimed at those new to foreign exchange markets. There’s also a Bitcoin guide. Be sure to make the most of them all. They were written by our seasoned trading experts and they’re all free.
--- Written by David Cottle, DailyFX Research
Follow David on Twitter @DavidCottleFX or use the Comments section below to get in touch!


