


Talking Points:
- The Nikkei 225’s uptrend endures
- But it has yet to retrace February’s sharp falls
- Doing so could be very tough
Join our analysts for live coverage of major Japanese economic data at the DailyFX Webinars
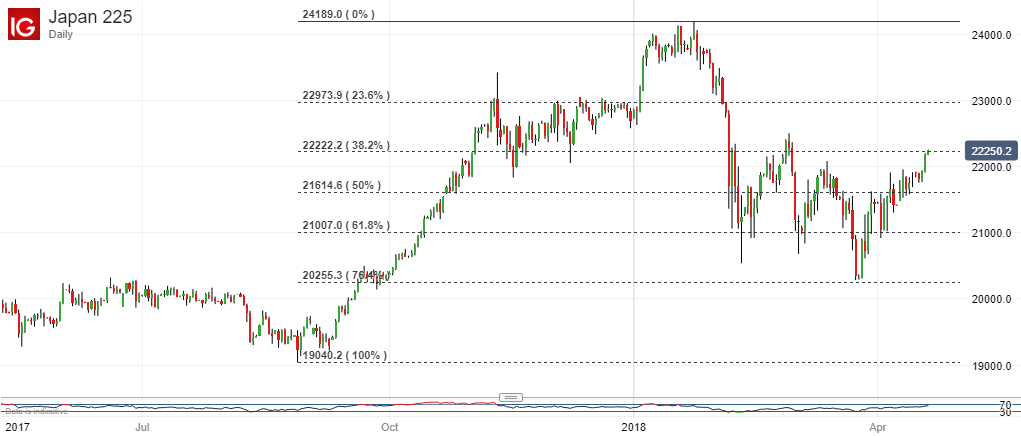
The Nikkei 225 remains firmly in the broad, strong uptrend which has been in place since the lows of late March.
It’s rise has taken it past the previous significant peak, which came in at March 13’s intraday high of 22,105.5. The index is now in a band of which that level now forms support and with near-term resistance at hand in the form of February 27’s intraday top, 22,498.
If the bulls can keep their uptrend going, they will soon face the perhaps daunting task of fully retracing the sharp falls suffered by the Nikkei between February 2 and 5. They took the Tokyo stock benchmark down more than 1,600 points and won’t be fully erased until the index tops 23,360.

This looks like a very big ask for the moment, although the index does seem to have its sights on that February top.
However, with its Relative Strength Index rising, albeit not yet into overbought territory, the index will probably need a consolidative pause around that level before setting out higher again.
Reverses will probably find initial support at the current uptrend line. It comes in at 21,879 at the moment.
There’s probably further support at 21614.6, That’ the 50% Fibonacci retracement of the rise up from last August’s lows to the highs of January. Below that lurks 61.8% retracement at 21,007 and 50% retracement at 20,255. Tellingly that last level is just about exactly where the Nikkei’s fall was arrested back in late March.
Resources for Traders
Whether you’re new to trading or an old hand DailyFX has plenty of resources to help you. There’s our trading sentiment indicator which shows you live how IG clients are positioned right now. We also hold educational and analytical webinars and offer trading guides, with one specifically aimed at those new to foreign exchange markets. There’s also a Bitcoin guide. Be sure to make the most of them all. They were written by our seasoned trading experts and they’re all free.
--- Written by David Cottle, DailyFX Research
Follow David on Twitter @DavidCottleFX or use the Comments section below to get in touch!


