


Talking Points:
- The Nikkei 225 has bounced back above a price band it clearly doesn’t want to spend too much time below
- The lower bound is formed by February 8’s intraday low
- That’s also an important retracement level
What makes the best traders stand out? Is it one factor or a combination? Check out the DailyFX deep, deep dive into the Traits of Successful Traders
The Nikkei 225 has staged a little bounce from the lows of last Friday. In some respects that’s not surprising. As with many Asia Pacific indexes the Tokyo stock benchmark has closely tracked Wall Street, often following the trade-spat newsflow between Washington and Beijing.
However, the Nikkei’s bounce is interesting because it has a technical story behind it too. Quite a good one.
It’s clear that the index does not want to linger in the 2053-21023 region for very long. Friday’s fall took it below that point, but it soon sprung back above it.
That’s quite usual. There have been intraday forays into that zone ever since the market neared it in early February. But none of them resulted in a daily close within the band, shown in blue on the chart below until last Thursday.

So, what’s so special about that range? At first glance very little. The band is bordered by nothing more, really, than the intraday low of February 9 and the daily closing low of the following session. Admittedly February 9 was one of those interesting days which offered a broad trading range but very limited difference between the open and the close. Such sessions can be signs of indecision, with the direction thereafter instructive. But it’s hard to see that it was so in this case given the quite modest price action since.
However, what the band’s lower bound does represent, almost to the point, is 61.8% Fibonacci retracement of the Nikkei’s long climb up from the lows of last April to 2018’s 26-year peak. That comes in at 20232.9
That’s just half a point away from that intraday low of February 9 -20533.4.
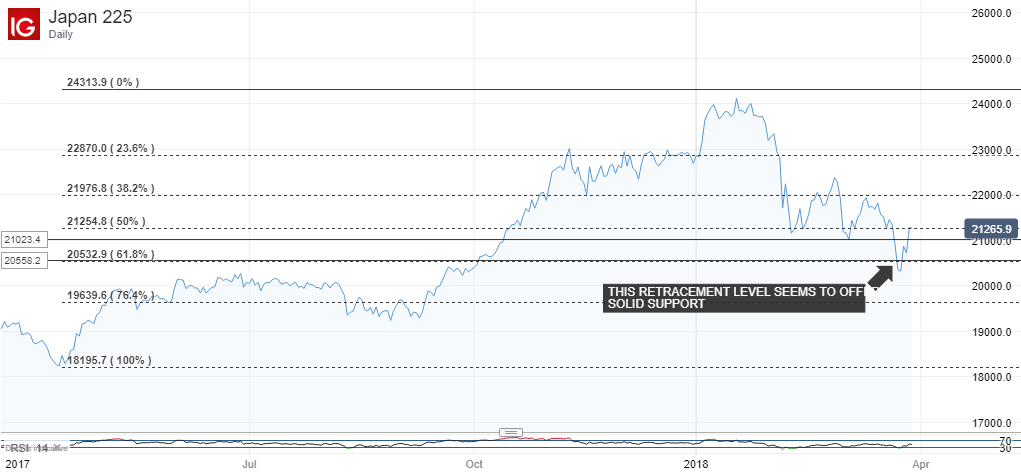
We can infer then that this retracement is currently providing the index with pretty strong support and that, for as long as it either holds or is quickly traded back up out of, then trade has a base. So far however the bulls aren’t showing the sort of fight necessary to push on much higher from it, whether it holds or not. The last significant peak was March 13’s intraday 22061 and that’s still some way above the market.
So keep an eye on that blue band. While it forms support then the market looks consolidative –but maybe only that. Should it give way on a weekly close then focus will be clearly on the downside. And the next retracement in this sequence doesn’t kick in until 19639.6.
Resources for Traders
Whether you’re new to trading or an old hand DailyFX has plenty of resources to help you. There’s our trading sentiment indicator which shows you live how IG clients are positioned right now. We also hold educational and analytical webinars and offer trading guides, with one specifically aimed at those new to foreign exchange markets. There’s also a Bitcoin guide. Be sure to make the most of them all. They were written by our seasoned trading experts and they’re all free.
--- Written by David Cottle, DailyFX Research
Follow David on Twitter @DavidCottleFX or use the Comments section below to get in touch!


