


Talking Points:
- The Nikkei’s trading range has become narrower
- And a pennant seems to be forming on the daily chart
- It might be time for the index’s long hiatus to end and for falls to resume
Become a better trader with the Free DailyFX Guide
The Nikkei 225 remains in the broad range which dominated trade since February, although there have been some interesting developments since.
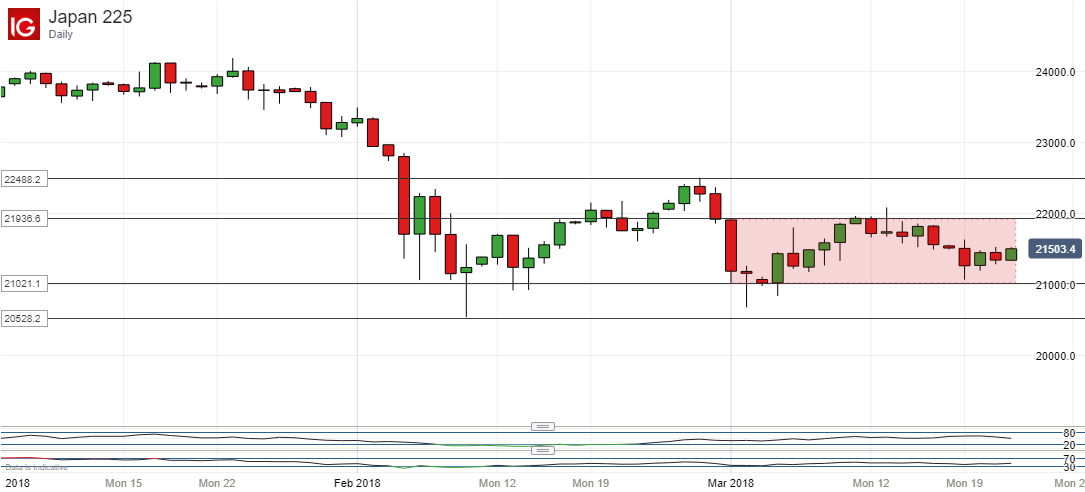
That wide band between February 27’s high of 22,500 and February 9’s intraday low of 20,565 remains very much in place, but the actual trading range has narrowed considerably as we have run on into March (possibly not coincidentally a similar pattern is visible in the USD/JPY currency pair). Now it would appear that all traders have to play with are the more miserly but still significant 977 points between March 11’s high and the lows of March 3. Those have effectively bounded all trade on an intraday-closing basis since the start of the month.
However, there could be something else going on here. The Nikkei’s tendency to range trade in the past two months has been a long hiatus in the preceding fall from 26-year peaks. What seems to be happening now, as that range trade narrows- apparently inexorably, is that that period of consolidation is coming to a close.
There’s more evidence of this in the tentative ‘pennant’ formation which has been forming on the same daily chart. That pattern comes about when there is a respected downtrend of lower highs poised to intersect with a mirror-image uptrend line formed of higher lows.
And here’s one…
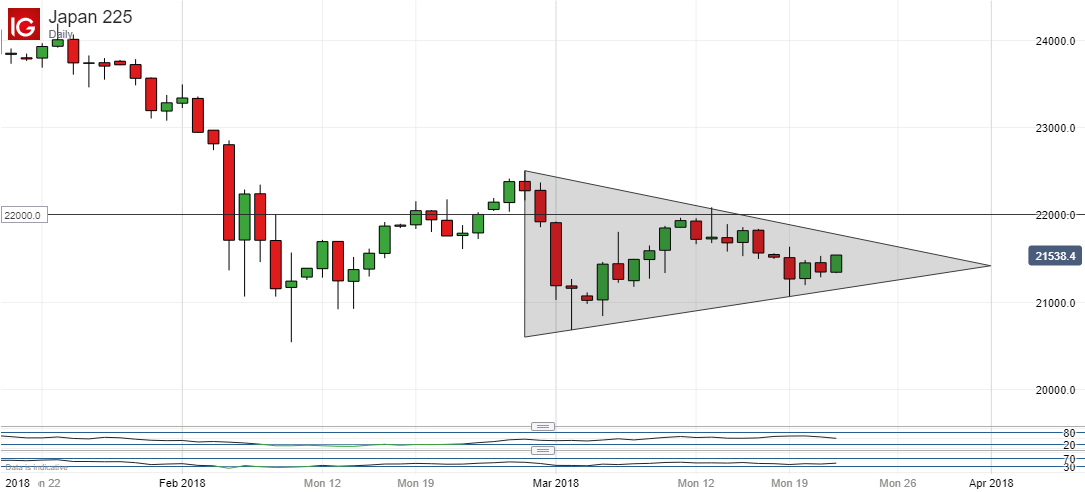
The pennant is a consolidation pattern too, one which suggests that the index will return to the preceding trend once it plays out. Now, admittedly this particular pennant is not hugely well supported- there are really only two intraday points to each of the trends which form it. But still, taken with that narrowing of the overall trading range, it hints that the argument for a maturing period of consolidation had some merit.
The bad news for bulls of course is that if the status quo were to resume, then we would see the Nikkei 225 headed lower still.
This need not mean massive falls, however. Still, it probably now makes eminent sense to keep an eye on that narrow-range bottom at 21,023 and to focus on the broad-range base of 20,565 if it breaks.
Resources for Traders
Whether you’re new to trading or an old hand DailyFX has plenty of resources to help you. There’s our trading sentiment indicator which shows you live how IG clients are positioned right now. We also hold educational and analytical webinars and offer trading guides, with one specifically aimed at those new to foreign exchange markets. There’s also a Bitcoin guide. Be sure to make the most of them all. They were written by our seasoned trading experts and they’re all free.
--- Written by David Cottle, DailyFX Research
Follow David on Twitter @DavidCottleFX or use the Comments section below to get in touch!


