


Talking Points:
- The Nikkei has settled into a narrow, elevated range
- However, it remains in an uptrend which began in October
- Retracement support looks strong
New to financial market trading? The free, DailyFX guide is all yours
The Nikkei 225 still looks remarkably comfortable even though it is currently around highs not previously seen since 1991.
The Japanese equity benchmark has been loitering around these levels for a couple of weeks now and, although it has lacked the impetus to push on it hardly looks as though it is preparing for a dive either. Momentum indicators are elevated, as they would be. But they don’t suggest rampant overbuying. The moving averages remain in pristine order too, with no troubling crossovers to report.
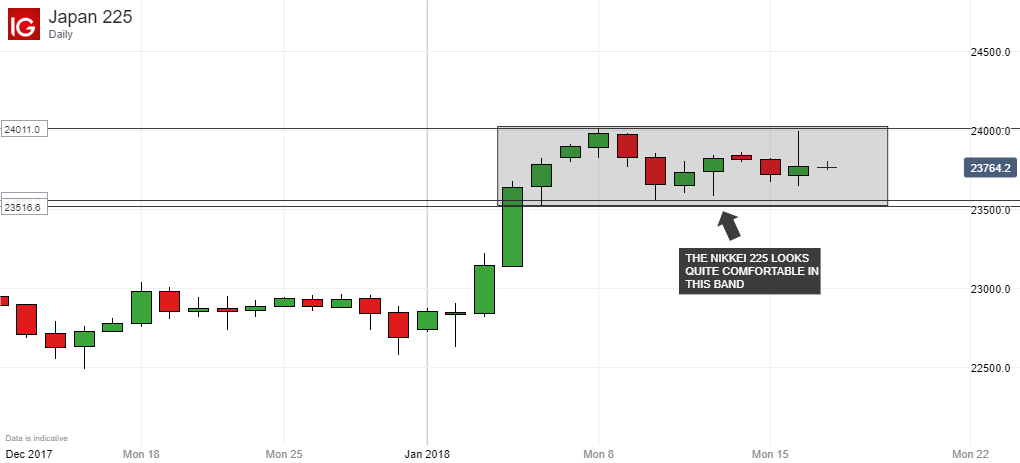
The index looks a little stuck in a band between 23,526 at the bottom and 24,011 at the top. That band has contained all the trading action since January 4.
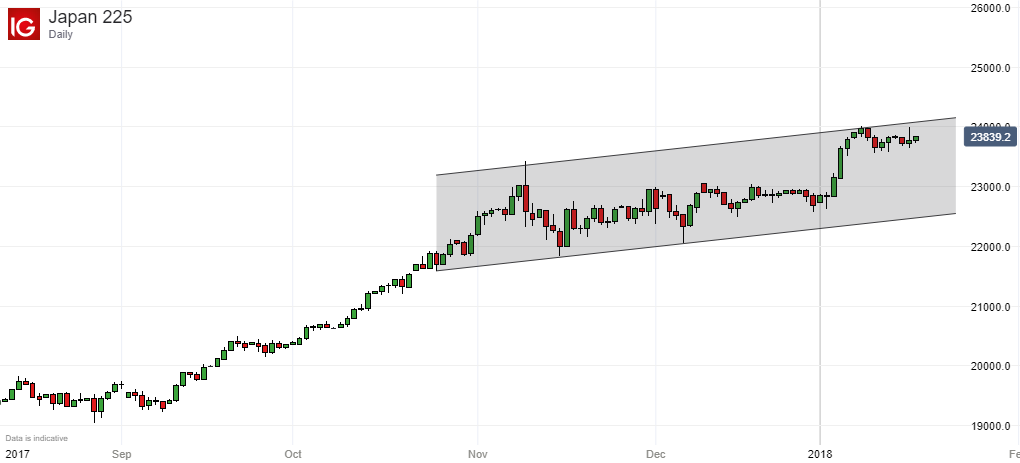
An upside push would have to crack the top of that band but, at this altitude, where it might go next is very hard to say. 1991 was too long ago for its memory to be much help. However, there is a quite compelling uptrend channel in play. It has been with us since October 25 and has been validated quite often, especially on the downside. A second upside test has just held too, suggesting that resistance beyond the merely psychological now exists in the 24,000 region.
The downside is better-known territory of course.
Under current range lows, the index is likely to find support at 22,878.6. That would be the first, 23.6% Fibonacci retracement of the long climb up from September 8’s lows to the highs seen on January 8.
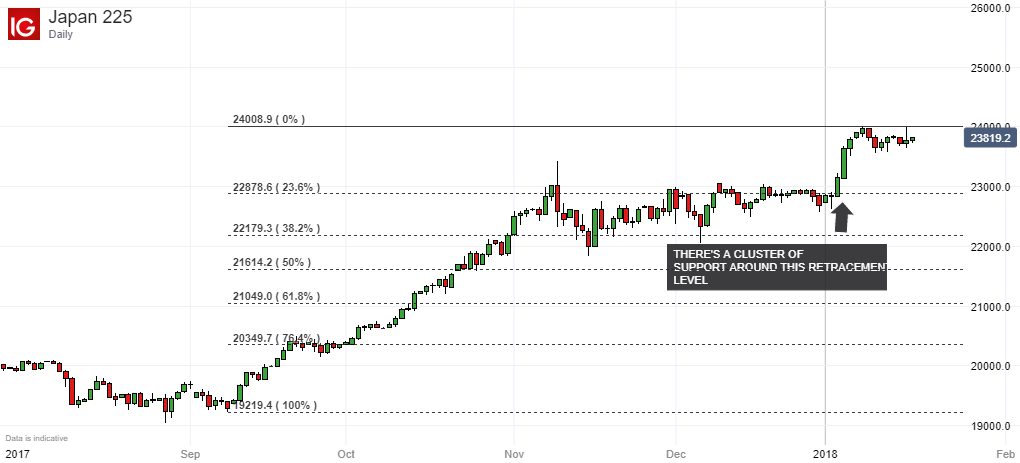
Sure enough, a cluster of index support in that region stretches all the way back to early November last year. Should all of those give way the next retracement (38.2%) will be found at 22,1793. This offers a less obvious prop than the first, however.
--- Written by David Cottle, DailyFX Research
Contact and follow David on Twitter: @DavidCottleFX


