


Talking Points
- The Nikkei remains very close to its highs for 2017
- This year’s trade has started with a dramatic upmove, mirroring Wall Street’s
- But the charts suggest more evidence is needed
Would you like to know more about Bitcoin? Our free guide has you covered.
The Nikkei 225 has started 2018 in bullish style.
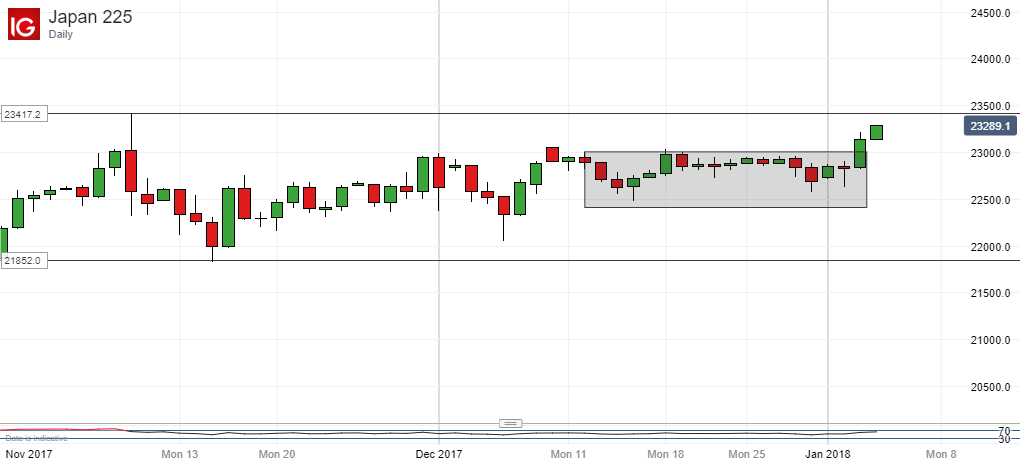
The clear, gradual uptrend from the lows of mid-November remains resoundingly in place. Indeed, it has pushed the index on to higher closing levels than it achieved in all of 2017. Of the old year’s action only November 9’s intraday peak of 23,417.2 stands as a market cap. That should fall in due course if current trends prevail.

But will they? The chart looks pretty neutral on most measures making it maddeningly hard to judge. Bullish momentum is certainly on the rise but the index certainly doesn’t look overbought at current levels. The simple moving averages are in pristine order too, with no mood-change crossovers obviously in place.
So it might be tempting to assume that we’ve just seen the final phase of a consolidation- bordered by the shaded area on the chart below. With that out of the way the status quo ante could be resuming, which would argue for further gains. The fundamental picture might too, with global stocks also starting the year with enthusiasm.
Still, as ever at this time of year caution is warranted. Markets remain holiday thin and full trading desks won’t be a feature until next week’s trade gets under way. It may be wise to see whether the Japanese benchmark can manage a daily or weekly close above last year’s overall high, and then whether it can hold on around that level into next week’s trade.
It need not be terrible news for the bulls if it can’t, as slips should find support around that consolidation area in any case. Current ranges look quite well established, especially that between November 9’s high and November 15’s low.
But this doesn’t look like the time to play for a decisive upside break without some more evidence. Don’t forget that we’re now dealing with altitude at which the benchmark has been absent since 1996. And it didn’t look too comfortable up here even then.
There’s probably not huge risk in waiting for that evidence. Fibonacci retracement of the long rise from Augist’s low’s up to 2017’s highs suggests first support at 23,389.77. That level has essentially held the index on a daily close basis since late November.
--- Written by David Cottle, DailyFX Research
Contact and follow David on Twitter: @DavidCottleFX


