


Talking Points:
- The Nikkei 225 is comfortable close to 25-year highs
- But it’s not showing any signs of immediate vigor
- The current range should probably be played into the new year at least
Find out where your favourite currency sits in the retail foreign exchange pecking order at the DailyFX Sentiment Page
The Nikkei 225 seems set to exit 2017 on something of a high.
The Tokyo equity benchmark posted its highest point this year quite recently. November 9’s intraday peak of 23,425.2 was not only the bulls’ best try for 2017, it was the highest they’d taken the index for 25 years.
And retracement since has been very modest. Investors are clearly in no hurry at all to bail out of the Nikkei, with broad range trade just below those highs seen through November and into December so far.
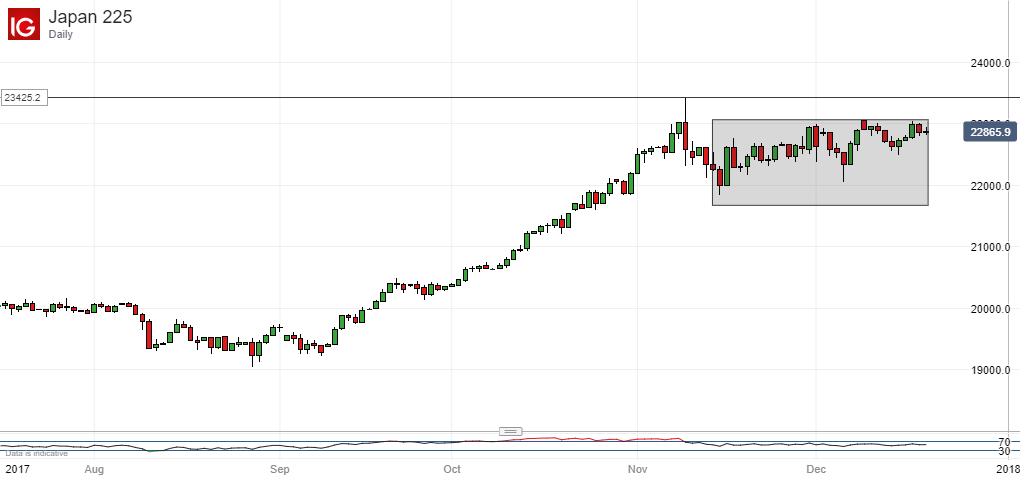
The range has certainly endured since last week’s technical look at the index.
This confidence at altitude is undoubtedly a welcome site for bulls and, probably, others as a turbulent year ends. The Nikkei’s place as handy proxy for global economic prospects is well established.
But equally there are as yet no obvious signs that the index will push on higher. Momentum indicators and moving averages are placid. The Relative Strength Index is now around the 50 mark. That means there no significant overbuying or overselling to be seen.
Admittedly there is now a modest uptrend channel in place on the daily chart. It comes in from November 15’s intraday low of 21,849.2 and has held good ever since.
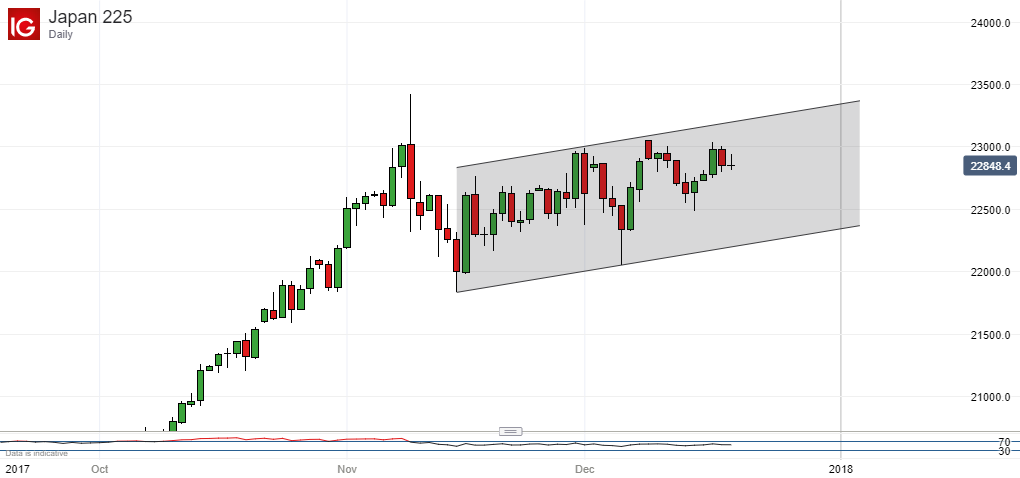
However, while there’s no clear reason to suppose it will falter before general financial market trade winds down for the holiday break, it must be likely that the current little upward foray from December 14’s lows has already faltered.
There’s no doubt that this impressively performing index can go higher from here, and the current range base may well present investors with a good opportunity to get long. But with liquidity only likely to tighten from here for the next couple of weeks the best near-term plan may well be to continue playing this established trading band.
--- Written by David Cottle, DailyFX Research
Contact and follow David on Twitter: @DavidCottleFX


