


Talking Points
- The Nikkei 225 has settled into a range just below its previous, impressive highs
- Still, there are plenty of clues suggesting that this is just a rest
- Once liquidity increases again, this index may well gain
Get trading hints and join us live and interactive for the top market-moving economic news at the DailyFX Webinars
The Nikkei has retreated a little after making highs not seen since 1992 earlier this month.
However, it hasn’t fallen very far and there may yet be cause for optimism that this index has yet more to give.
After a long, sharp climb from early September, some pause for reflection had to come. Sure enough, the Nikkei has broken below the quite valid uptrend channel from those days. But the bulls who drove the index to those recent, impressive highs don’t seem to be regretting their exuberance to any marked extent.

Retracement has been relatively modest and the index has settled into a range with a broad lower bound at 22,000. In so doing it managed to burn off some of the momentum excesses which plagued it at the highs. It looked quite seriously overbought at the start of this month, but its Relative Strength Index has since moved down to much more relaxed levels. They’re probably more sustainable levels for that.
And if we look at the same chart from a slightly different perspective we can also see the possible formation of a continuation pattern which could flag more gains ahead. What we have here is a pennant, where the upward and downward trendlines narrow towards one another.
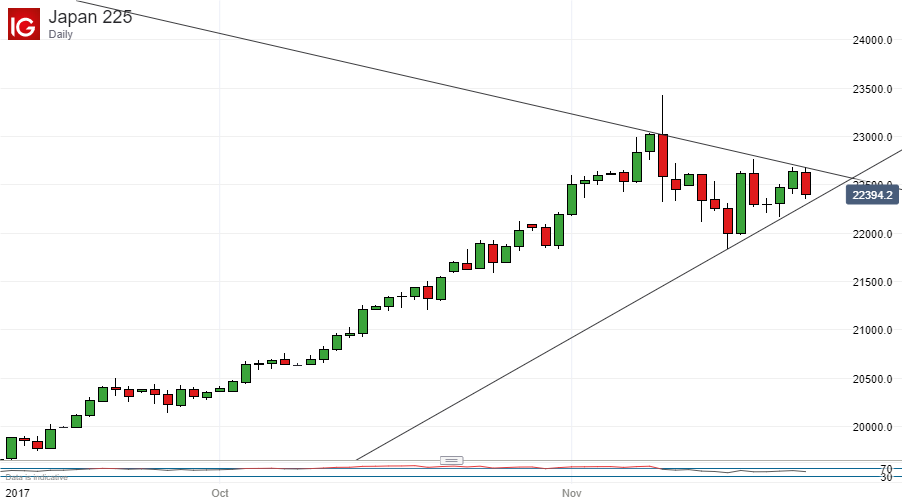
On this chart I have taken November 17’s intraday peak as a spurious point and used the previous day’s close instead as it seems the more valid interpretation. But, of course, the pennant’s characteristic downward sloping trend line of lower highs would still be seen using that former peak.
The pennant usually speaks to that period of consolidation which often occurs before a trend resumes. It’s reasonable to assume that the US Thanksgiving break, allied to Thursday’s Japanese market holiday, will remove a great deal of market liquidity and, possibly, result in some false moves.
But the relaxation of overbought momentum, the lack of significant falls and the clear presence of a pennant make a resumption of the Nikkei’s impressive upside the most likely prospect once trading desks are again more fully staffed.
--- Written by David Cottle, DailyFX Research
Contact and follow David on Twitter: @DavidCottleFX


