


Talking Points:
- The Nikkei 225 has soared since early September
- It remains vigorous, too and is currently testing the upper reached of its channel
- However, overbuying is now quite severe and needs to cool down
Find out where your favorite currency sits in the retail market pecking order at the DailyFX Sentiment Page.
The Nikkei 225 continues to sweep aside the doubters and make new highs. Indeed, its steep climb up from the lows of early September have taken it to peaks not scaled since 1996.
What’s more a look at its daily candlestick chart finds the index threatening to break to the upside of the channel which has so far contained its astonishing upward thrust. This looks like an index with more to give.

Naturally such exuberance comes with a price and, even if you’re completely relaxed by the sight of these altitudes, it’s easy to see what that price might be.
Sure enough, the Relative Strength Index suggests that the Tokyo stock benchmark has been completely overbought since October 9 and, at 76 on the IG chart, that it remains worryingly so. Any RSI number above 70 is usually enough to set alarm bells ringing. The Nikkei has now been above that for over a month. That’s a very rare sight but this has been a very rare rise.
Still, it’s clear that some pause for reflection would be reassuring here, even if the index pushes on still higher once it’s over. For all the record highs we’ve seen on Wall Street this year, don’t forget that the Nikkei remains well short of its own best-ever level. That was recorded very close to 39,000 in the heady days of 1989.
But where might any pause itself pause?
Well, the Fibonacci retracements of the road from September 8 to the present day look useful here. On this analysis support would come in at 21800. That’s the 23.6% retracement. Below that there’s 21306.9, the 38.2% retracement.
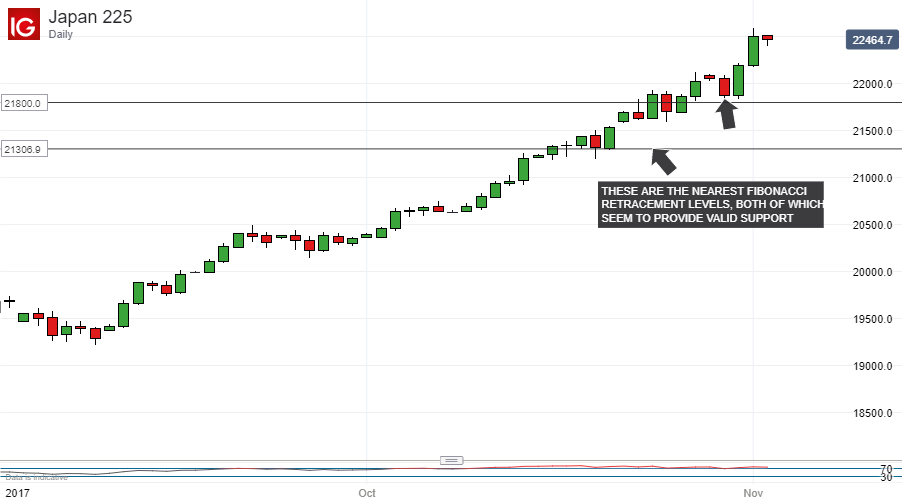
As you can see trading action was clustered around those levels on the way up, on October 24-27 and October 17-20.
Further down it’s probably worth keeping an eye on the 20,800 level. The Nikkei has had in interesting relationship with this number. It acted as a top in both 1993 and 1994 and, while the index did punch above it in 1997, the conquest proved exhausting and it soon fell back. The 20,800 are capped the index again in 2000 and yet again in 2015. It remains a level to watch if the index retraces.
--- Written by David Cottle, DailyFX Research
Contact and follow David on Twitter: @DavidCottleFX


