Talking Points:
- The Nikkei 225 has just managed a record breaking winning streak
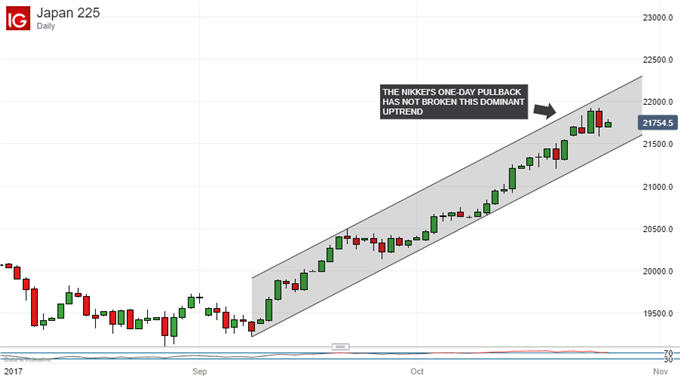
- And Wednesday’s pullback has not notably dented its very dominant uptrend
- However, while more upside looks probably, a pause would make great sense
A new quarter is under way, what will it bring? Check out the new Fundamental and Technical Forecasts from DailyFX
The Nikkei 225 made headlines this week simply by not rising for a day.
The index finished Wednesday down 0.5%, ending a record 16-session winning streak. The previous best-ever run had been 14 days. That one petered out on January 11, 1961.
This year the Tokyo equity benchmark’s stunning strength has seen it rise to 21-year highs as growing Japanese economic prowess meets the prospect of plenty more “Abenomics” stimulus now that Prime Minister Shinzo Abe has secured his election win.
So much for the fundamentals. Despite Wednesday’s pullback the Nikkei remains remarkably high and, judging by its Relative Strength Index, remarkably overbought too. Can it hope to stay at the heights and maybe even push on up?
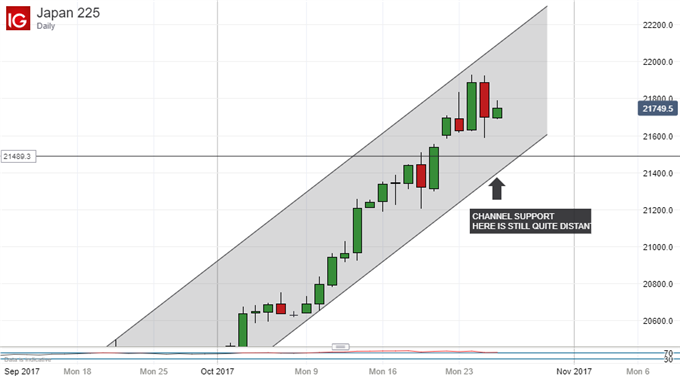
Well, we are surely at a point where some pause for reflection would be not just orderly but probably seemly too. The momentum indicators look very stretched and do need to calm down. However, it’s worth noting that the dominant uptrend channel which has contained all the action since the market turned higher on September 8 – including Wednesday’s pullback – remains very much intact. Wednesday’s pullback has not tested its downside at all.

What’s more, at current levels the index remains a couple of hundred points and then some above where channel support would come in. That’s now at 21,398.

However, recent gains have been so sharp that it’s hard to spot areas of obvious support which might hold convincingly should the market decide to test the downside below that channel’s bottom. The two closest Fibonacci retracement levels of the uptrend from September 8 to Tuesday’s top come in at 21,289.9 (23.6% retracement) and 20,894 (32.8% retracement). These might be points to watch if the channel does give way.
If it doesn’t, the curent channel-upside target would take the index above 22,000. That is certainly thinkable from here and, assuming the channel holds, looks like the most probable scenario in the coming days. However, if it does scale thouse heights without a period of consolidation first then the overbuying will become extremely severe, which may make the retracement, when it comes, all the stronger.
--- Written by David Cottle, DailyFX Research
Contact and follow David on Twitter: @DavidCottleFX


