Talking Points:
- Japan’s equity benchmark has bounced at the point where it started 2017
- But it remains in clear downtrend and bulls have much to do
- Their first task is to avoid another “lower high” and even that looks like a tall order
How do retail traders view your favourite currency of the moment? Check out the DailyFX Sentiment Page
The Nikkei 225 shares a couple of tantalizing traits with its Australian counterpart, the ASX 200.
Both are in clear downtrends from 2017’s highs, which the former made in June and the latter in May. However, falls since have so far been modest in both cases, suggesting investor appetite to hold the indexes at what remain quite elevated levels.
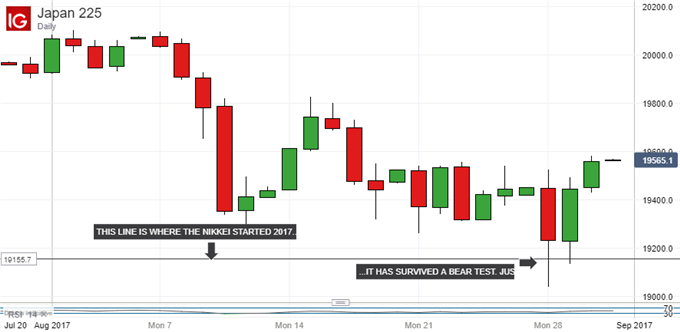
And, just as ASX bulls have just mounted another doughty defence of the year’s lows, the Nikkei has just bounced right at the point where its 2017 gains were coming under threat.
19155.7 is the level to conjure with. That’s where the Nikkei was on January 2017’s first trading day. The index has managed to probe just below that point on an intraday basis in the past week. But it has yet to close below the line and, in the last couple of days, has staged a little fightback.

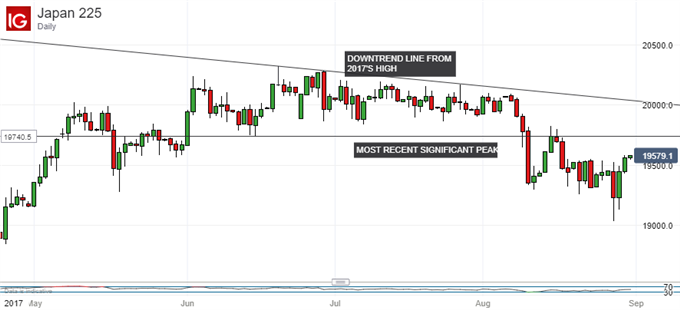
Still, while bulls have shown some pep they have much yet to do if they’re going to make a base from which to strike out higher. The Nikkei remains very well short of the downtrend line drawn from June 20’s peak. To break back above that would require a 500-point rise from current levels.
That seems a distant prospect, if it’s any sort of prospect at all. But even more realistic goals are under threat. This week’s push higher will have to make it above the last significant peak to convince investors that they are not merely seeing another ‘lower high’ as prelude to a further crack at the year’s lows.
That comes in at 19740.50 and as things stand, topping it sustainably looks like quite an ask.

On the basis that we might, just, be seeing the end of the (Northern hemisphere) summer lull, the uncommitted might just want to wait and see whether the index can indeed find a foothold soon. But the path lower still looks like that of least resistance.
--- Written by David Cottle, DailyFX Research
Contact and follow David on Twitter: @DavidCottleFX


