


Talking Points
- A broken downtrend need not be awful news for the Nikkei 225
- It could simply be consolidating at an encouragingly high level
- However, watch the monthly chart. It may have a more worrying tale for us
Get live coverage of all the key Asia/Pacific economic data with the DailyFX webinars
In technical analysis, as in life, a sense of perspective can be crucial.
To be sure, looked at from one rather obvious perspective, the Nikkei 225 is in trouble. For on June 7 the index clearly broke away to the downside from an uptrend channel which had sustained its impressive gains since April 17. What’s more that was the second downsidw break in short order. And, unlike in its first loss of footing at the end of May, the index did not swiftly regain its composure. It remains below that channel. Indeed the downside break now looks quite conclusive, having endured for six sessions.
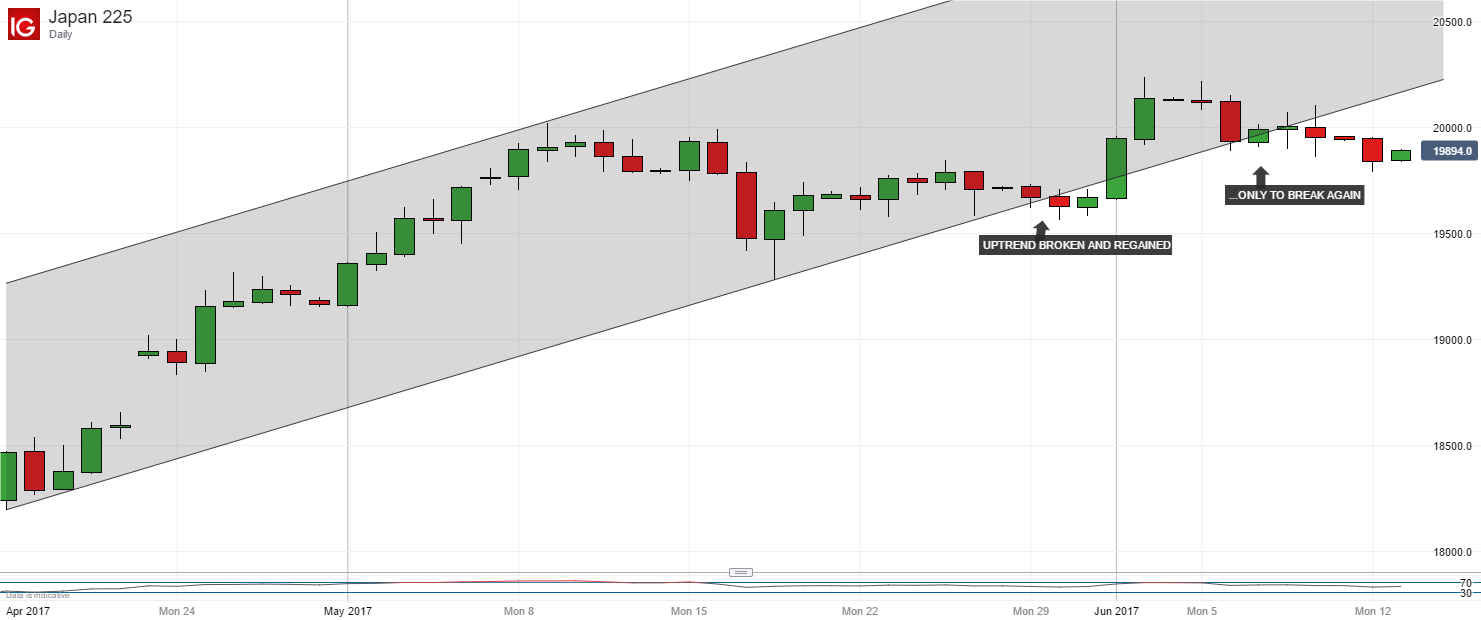
But this is where some perspective seems warranted. For, despite abandoning that uptrend, the index has hardly suffered any catastrophic fall. Indeed, it remains close to its peak for the year, which is also its highest point since late 2015. Channel break or not, many investors are still happy to hold on.
And, if we change our perspective and look at the action since the start of 2017, what we see is an index consolidating its climb from April’s lows quite convcingly. It’s also settling into range trading at a much higher level than that which has pertained for much of the year. That range doesn’t look obviously threatened either. The Relative Strength Index (RSI) is in “relaxed” territory, well below the 70 level which might set the alarm bells of overbuying to chime. Should bulls be cheered?
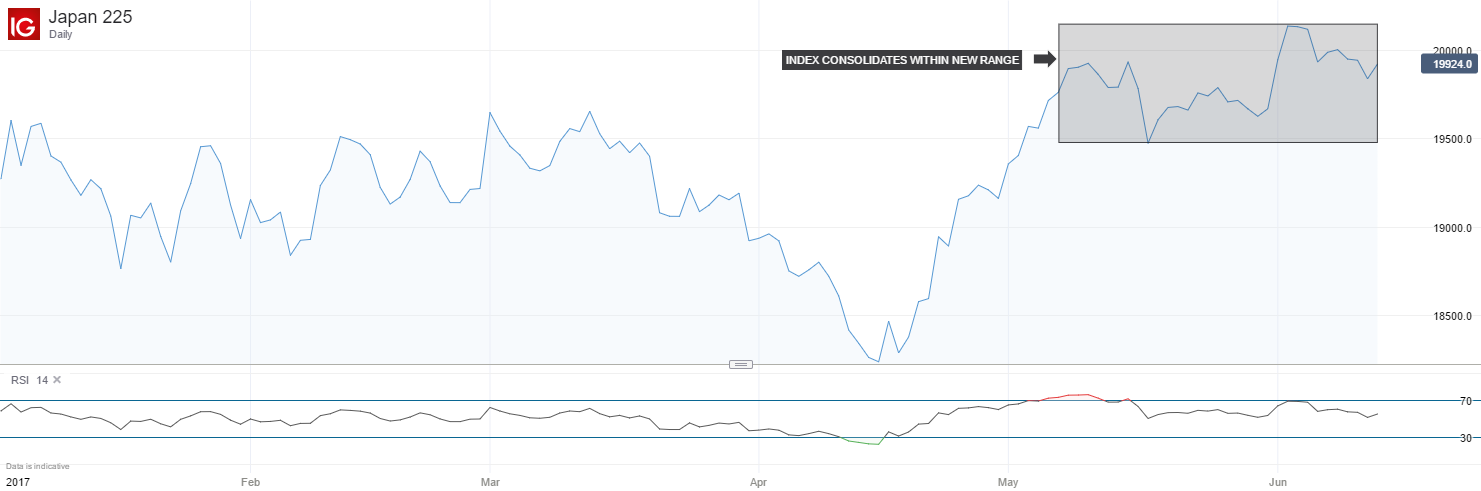
Well, perhaps. But clearly none of the above means that the index is absolutely safe from a sharper downturn, nor that the uptrend channel break we talked of earlier is inisgnificant. But clear signs of consolidation so close to important highs are at least encouraging.
However, I think it’s perinent to end with a word of warning, even if it requires us to flip perspective yet again. On its monthly candlestick chart the Nikkei looks very much like an index which is developing a double-top formation. This is usually a bearish signal and it happens when an index peaks, then forms a shallow trough only to peak again – for the last time before retracing.
A look at this chart shows that first peak in place, then that shallow trough. Another assault on the peak is in play.
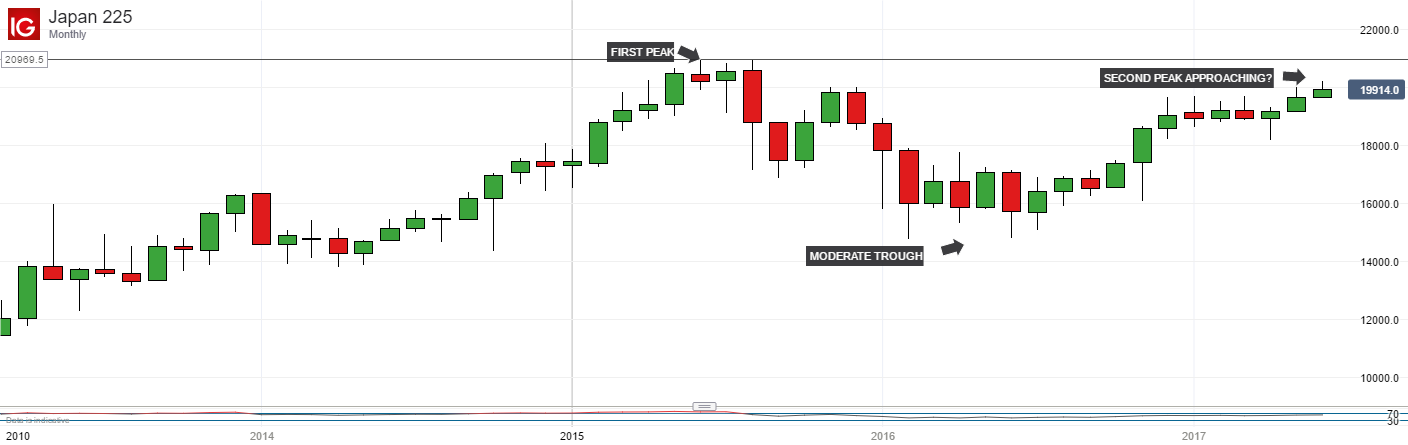
This will bear watching, even if on shorter term charts the Nikkei still apears to be merely consolidating. Something more sinister could be up.
--- Written by David Cottle, DailyFX Research
Contact and follow David on Twitter: @DavidCottleFX


