


Talking Points:
- Nikkei 225 hit short term resistance at 15,800 after a move higher as trading resumed
- A hold below resistance might put the spotlight on the 15,000 support
- 16,000 may need to be cleared for further corrective gains
Learn good trading habits with the “Traits of successful traders”.
The Nikkei 225 is edging higher to start the trading week, seemingly on the backdrop of the Japanese elections.
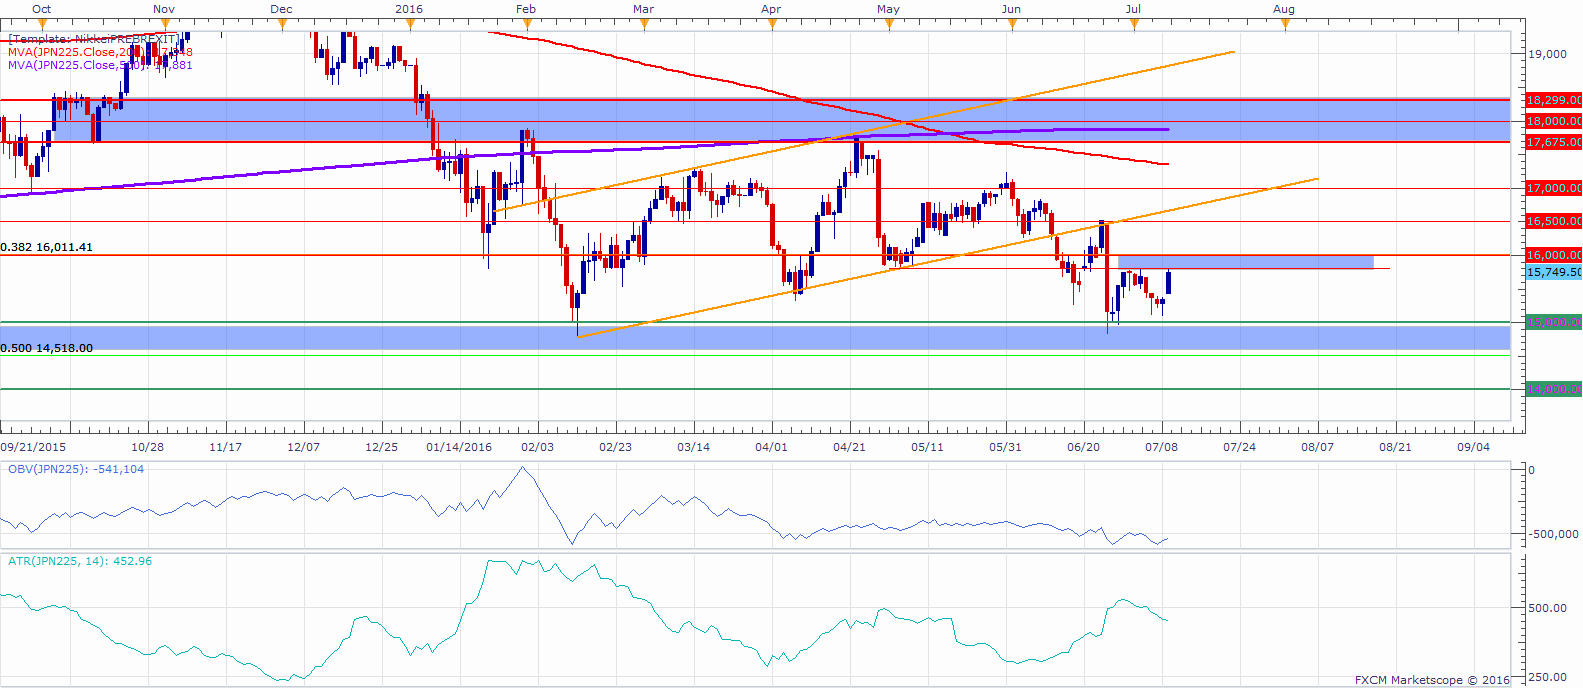
The index bounced from an area of support between the 0.50 Fib at 14,518 (As was drawn for the last monthly leg higher from the June 2012 low at 8,190 to the June 2016 high at 20,961) and the 15,000 handle, but have since failed to move higher than 15,800, which combined with the 16,000 handle might signal an area of possible resistance.
The price has been ranging between the well-defined 18,000 resistance zone and the 15,000 support since the start of the year, with gains appearing to be corrective in the context of the near term down trend from June 2015 highs.
In this context, the move to the upside might need to move above 16,000 to see further buying conviction, which might expose the 16,500 level that also coincides with possible broken trend line resistance.
If the index manages to find strong conviction to move below the 15,000 level, this may mark an end to the 2016 sideways action, which might put focus on possible support at the 14,000 handle and the 13,000 level, which coincides with the 0.618 Fib of the long term uptrend.
Nikkei 225 Daily Chart: July 11, 2016
--- Written by Oded Shimoni, Junior Currency Analyst for DailyFX.com


