


DAX/CAC Technical Highlights:
- DAX has been choppy, with downside held in check by big support
- CAC also has several angles of support in the same vicinity to lean on

DAX & CAC Technical Analysis: In Choppy Market Support Holds the Key
The DAX has been bouncing around in relatively directionless fashion, but overall the chart is still tilted towards the downside with price trading under a 200-day moving average that is rolling over. The overall price action since April has a topping look to it.
But for the downside to really come into play important support around the 14800 line needs to break. It is a level that continues to grow in strength with each test, the last coming on Monday when we saw the DAX reverse in powerful fashion and post a bullish reversal candle.
The repeated test between 15000 and 14800 in recent weeks hints at the notion that it may soon break, but until it actually does we must respect support until broken. This leaves shorts in limbo. The long-side given the general tone of the market isn’t favorable, though. Overall, the lack of indecision at moment leaves the market in a holding pattern.
DAX Daily Chart

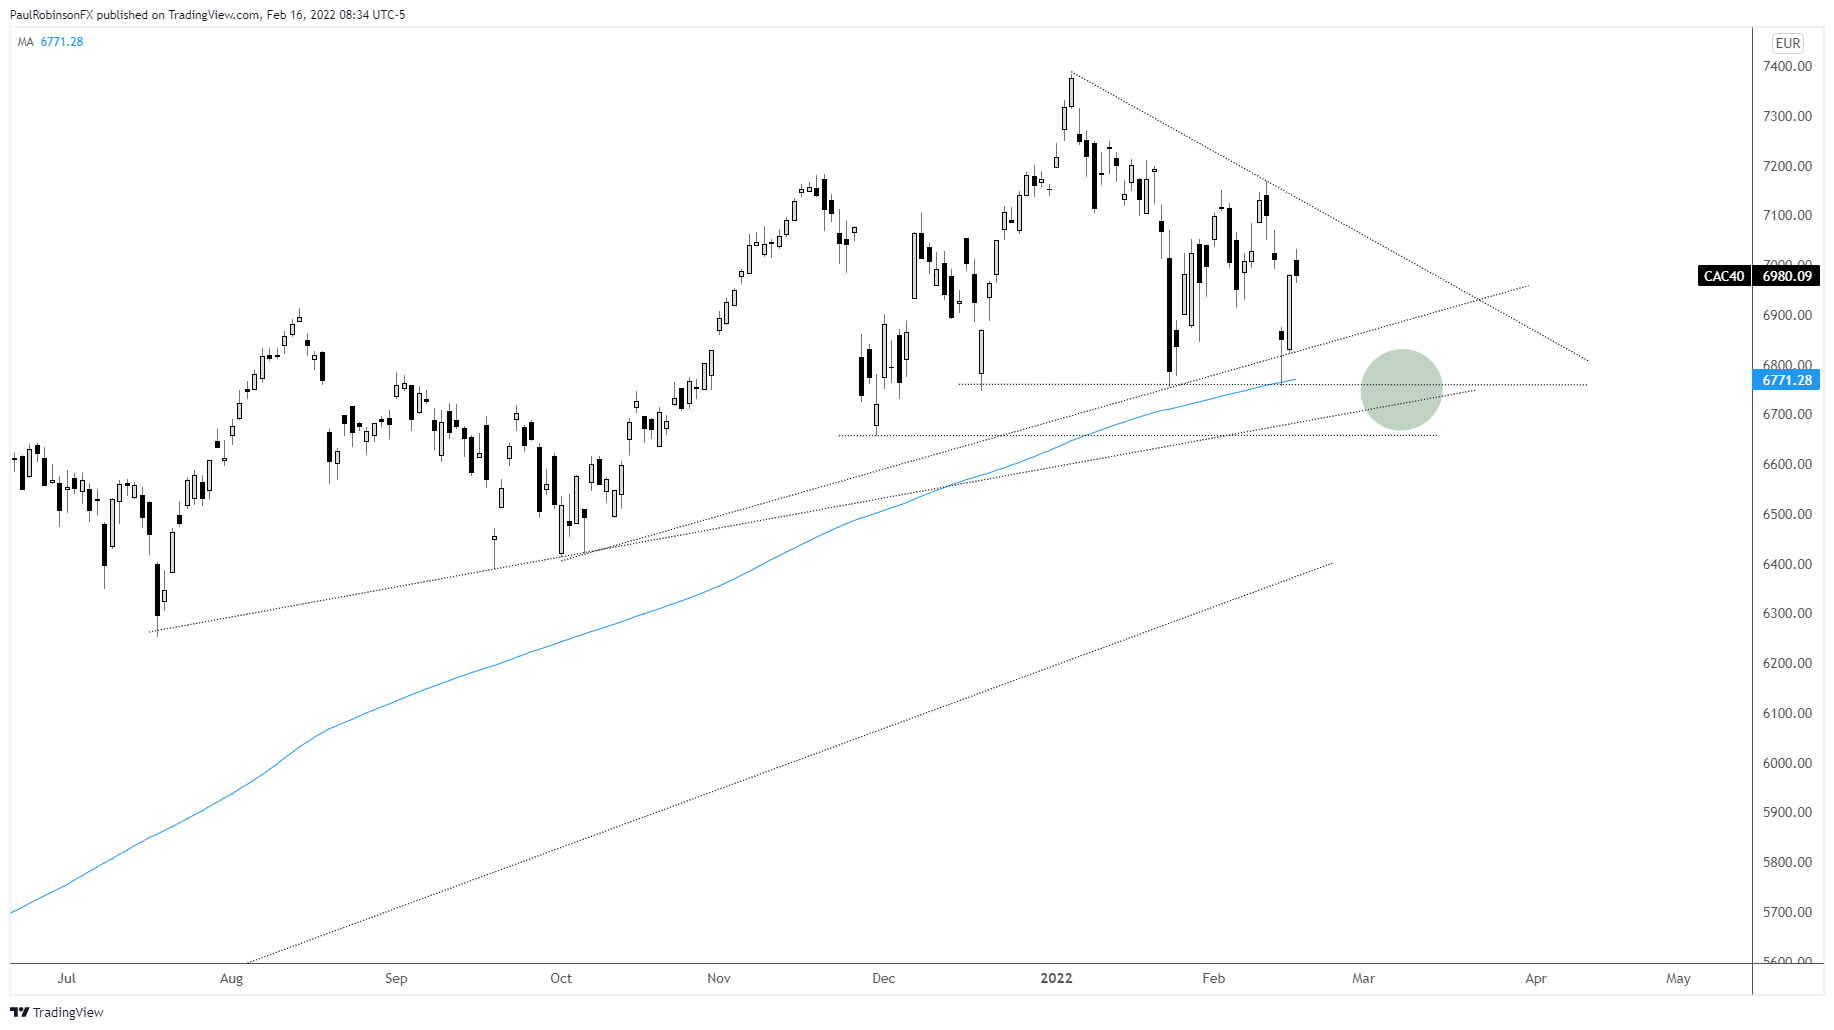
The CAC is coming off its first test of the 200-day moving average since it broke above it in November 2020. There are other lines of support in the vicinity of the 200-day that are/will also help keep the market supported for now. Horizontal support since December, a trend-line from October and July.
Price action since early January is taking on the shape of a descending wedge, which could lean the market towards an eventual break of support. But not necessarily as wedges, even descending, can break to the top-side. Like the DAX, the CAC is stuck at the moment where it leans neither bearish nor bullish.
CAC Daily Chart
Resources for Forex Traders
Whether you are a new or experienced trader, we have several resources available to help you; indicator for tracking trader sentiment, quarterly trading forecasts, analytical and educational webinars held daily, trading guides to help you improve trading performance, and one specifically for those who are new to forex.
---Written by Paul Robinson, Market Analyst
You can follow Paul on Twitter at @PaulRobinsonFX


