


DAX/CAC Technical Outlook:
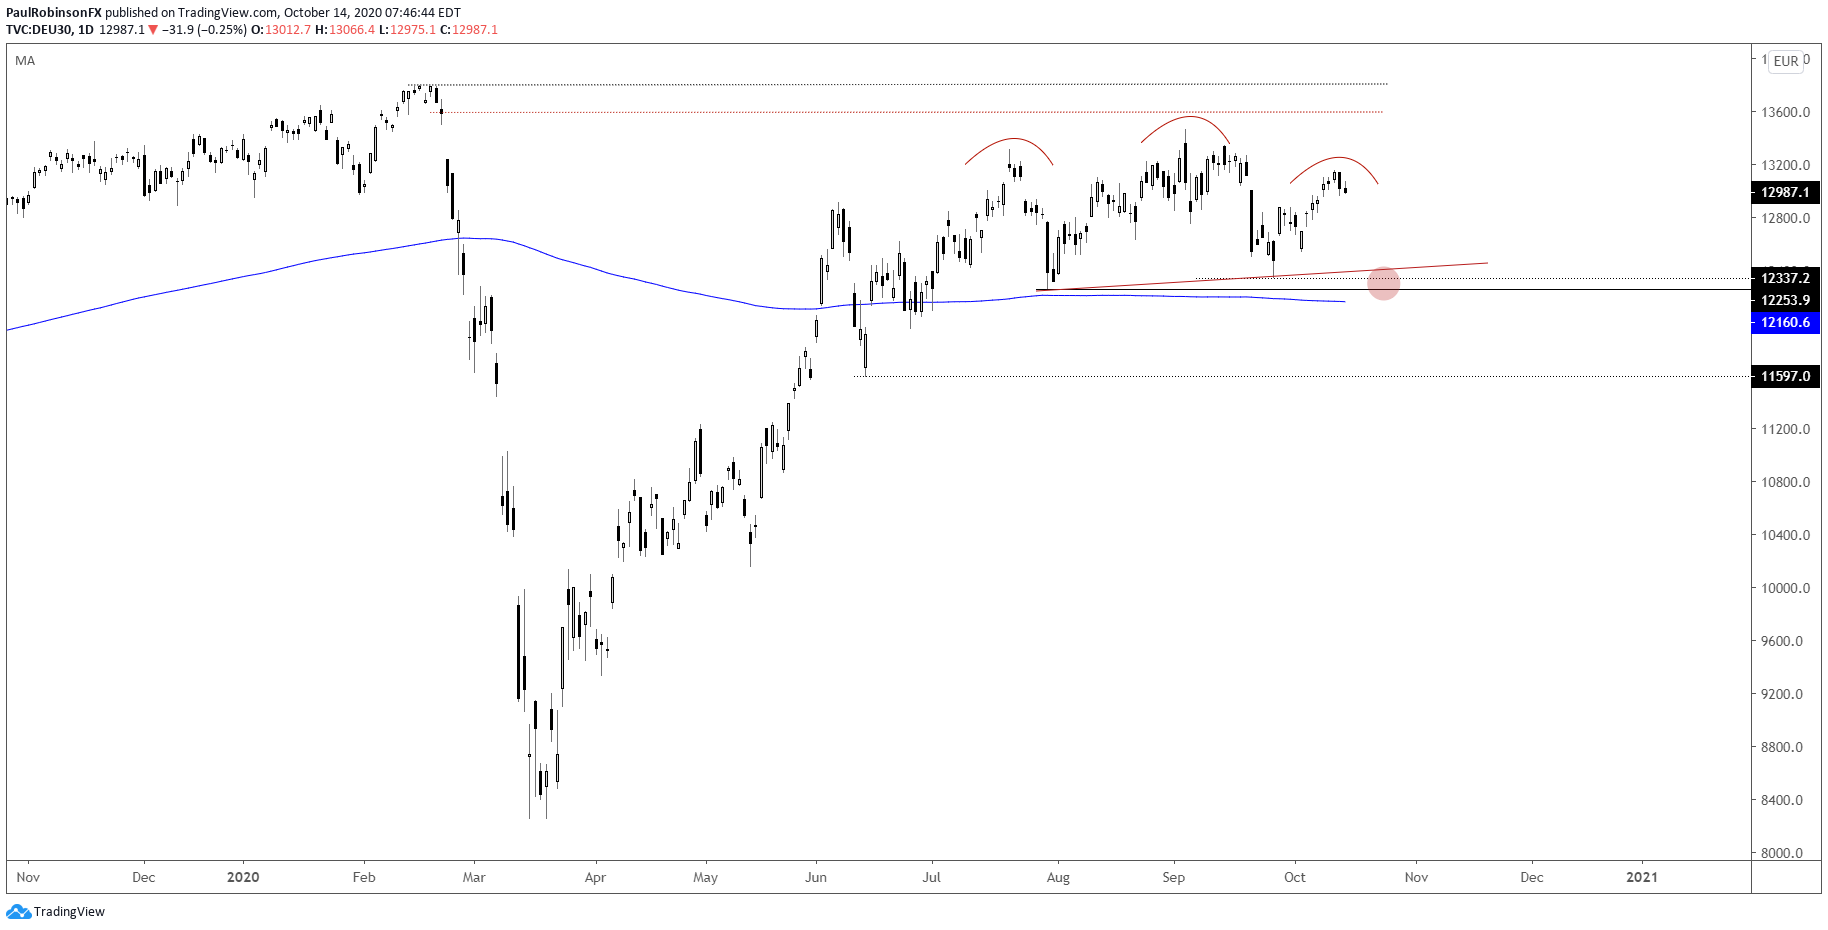
The DAX hasn’t done a whole lot on a net-net basis since we looked at it a week ago. The same broad, potentially bearish, head-and-shoulders (H&S) pattern is still developing. The left shoulder and head are in place, but we still need a right shoulder to develop and subsequent break of the neckline before we can run aggressively with a bearish bias.
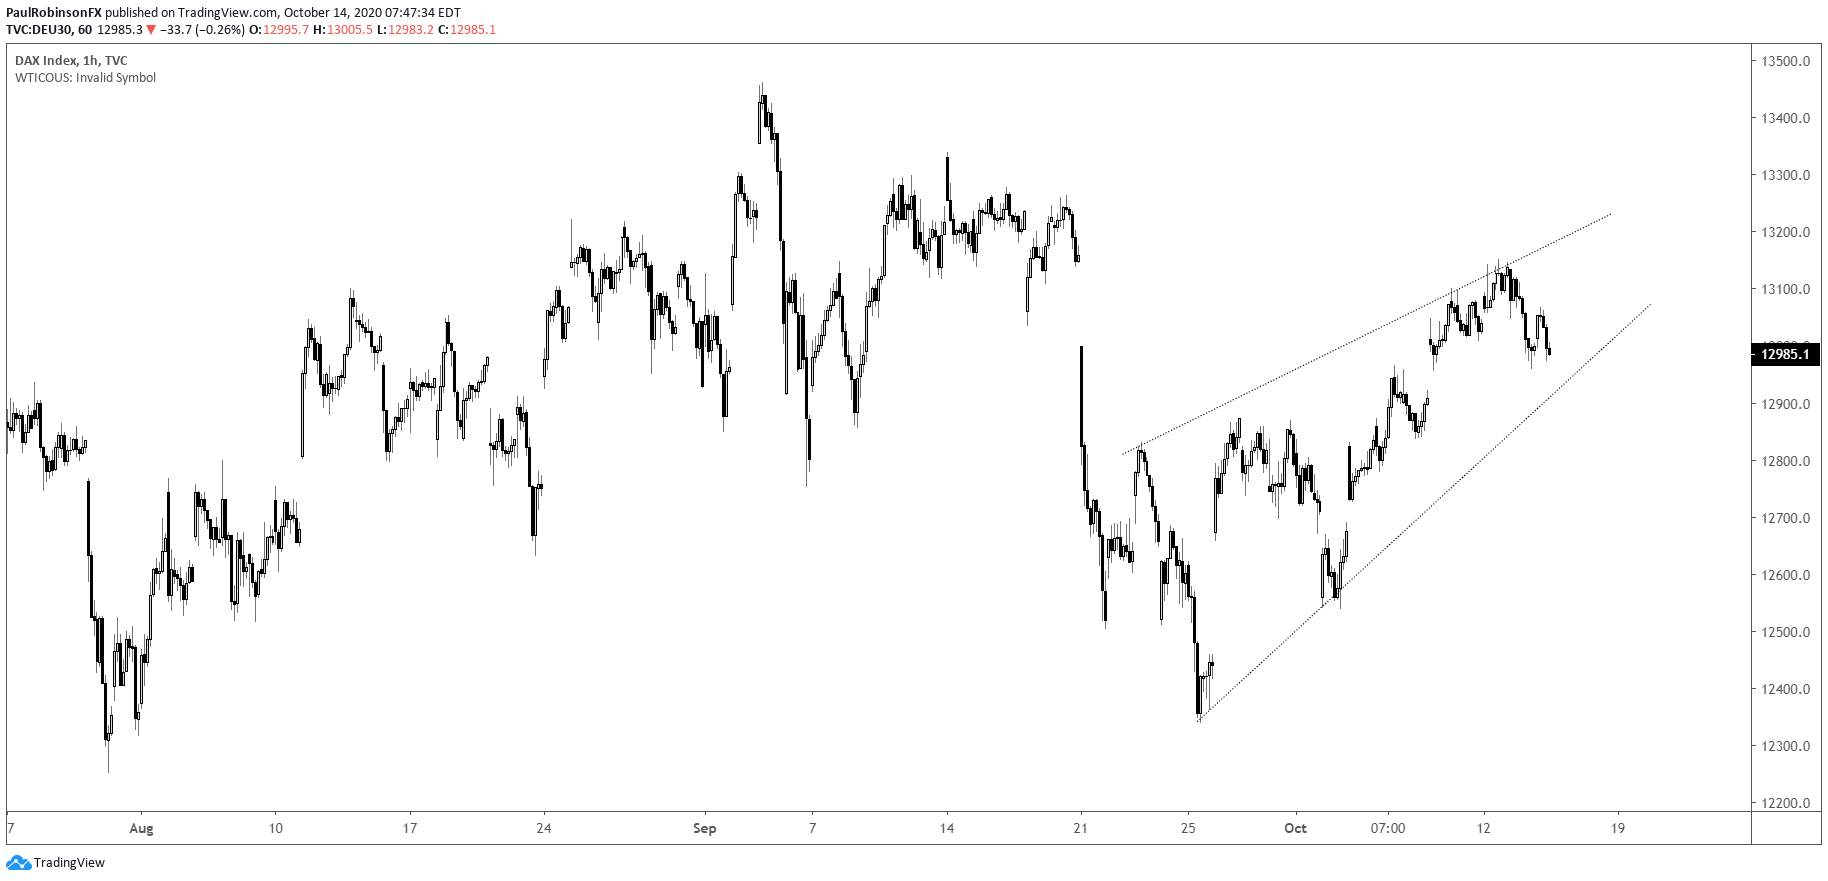
The right shoulder could still take on the shape of a rising wedge that provides short-term traders with a look first before the neckline down near 12400 is tested and possibly broken. The area around the neckline has both good price support and not too far below at 12162 lies the 200-day. A break below all thresholds at some point could lead to a strong move.
But before getting ahead of ourselves some work is in order. Should we continue to see strength then the coronavirus kick-off gap at 13579 could finally get fully filled, with the record high at 13788 just around the bend. But it is altogether possible neither scenario bares any fruit as the DAX has generally traded sideways since early June. Eventually, though, we will get another solid move.

DAX 30 Daily Chart (H&S pattern potential)
DAX 30 Hourly Chart (Rising wedge formation…)
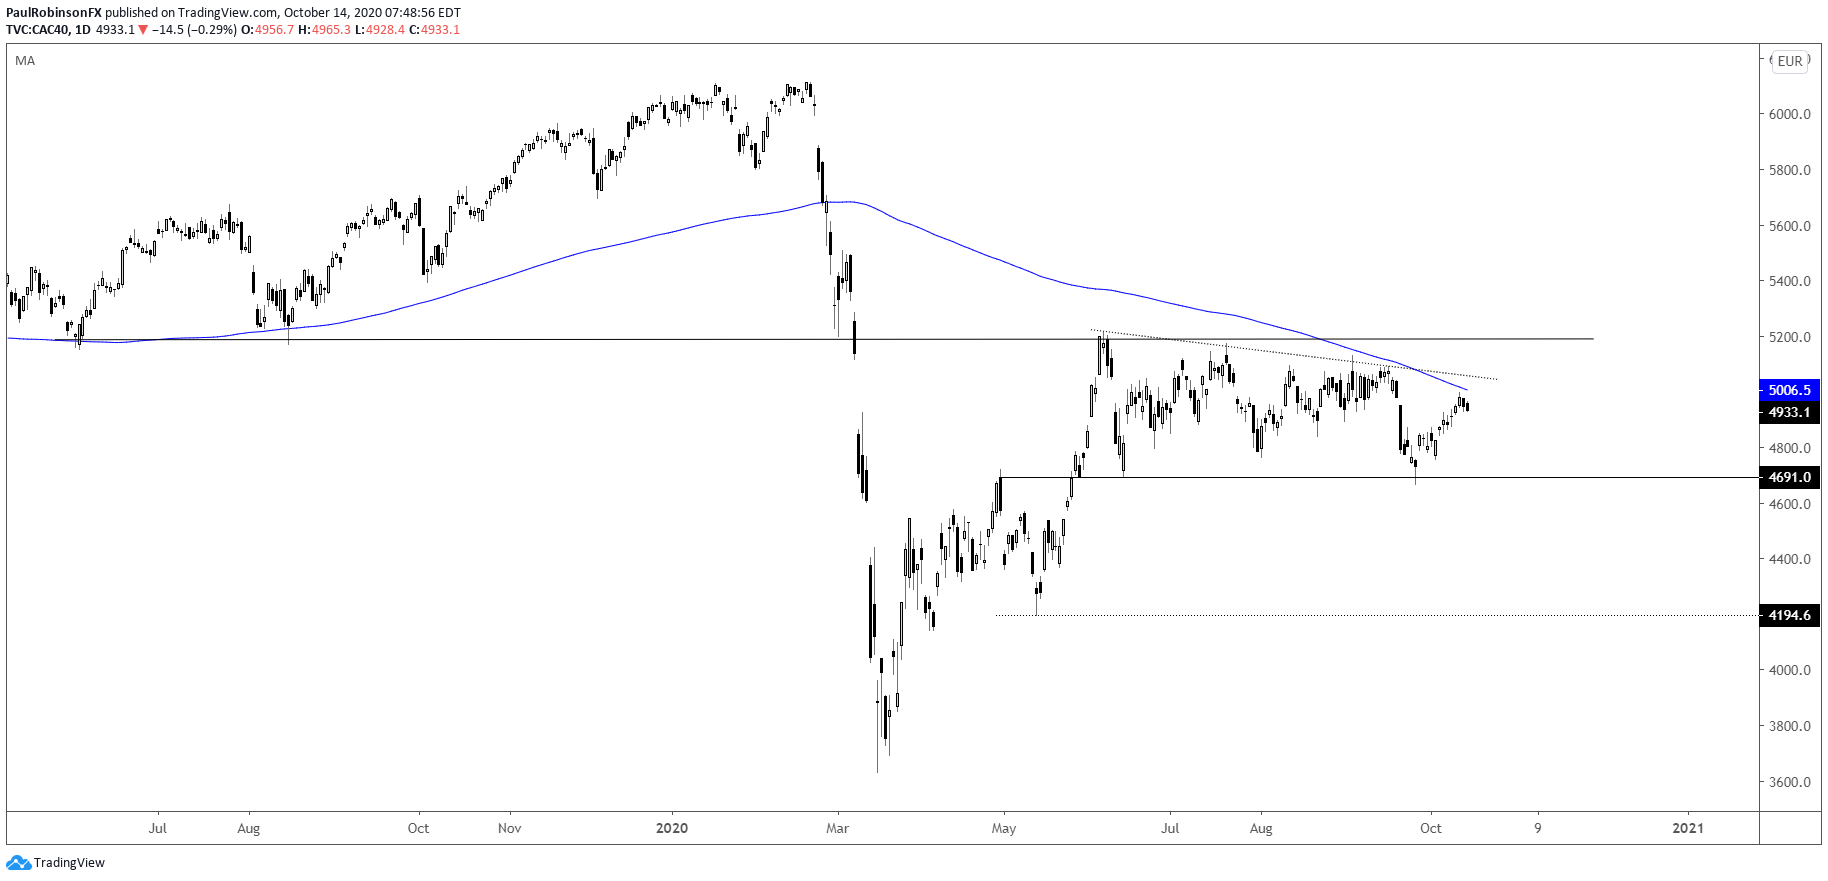
The CAC is much weaker than the DAX, and should we see a broad sell-off unfold it is likely to hit the French index with more force. The 200-day moving average at 5012 and a trend-line from June stand in the way of the CAC moving much higher right here. In the near-term, watch the trend-line off the September low for cues as to whether it wants to trade lower. The real big level of support to watch is around 4691, a level that began back at the end of April. The big level of resistance in the range is 5213. One of these levels needs to be broken before a broader move can develop.
CAC 40 Daily Chart (range-bound until one side breaks)
CAC 40 hourly chart (watch the trend-line...)

Forex Trader Resources
Whether you are a new or experienced trader, we have several resources available to help you; indicator for tracking trader sentiment, quarterly trading forecasts, analytical and educational webinars held daily, trading guides to help you improve trading performance, and one specifically for those who are new to forex.
---Written by Paul Robinson, Market Analyst
You can follow Paul on Twitter at @PaulRobinsonFX


