DAX 30/CAC 40 Technical Highlights
- DAX trading near 13k, top-side resistance lines
- CAC breaking out above wedge resistance
For fundamental and technical forecasts, trade ideas, and educational guides, check out the DailyFX Trading Guides page.
DAX trading near 13k, top-side resistance lines
The DAX has been relentlessly strong after bottoming out early in the month. There might be a pullback sometime soon, but without bearish price action betting on such an event doesn’t hold a strong edge. If recent price action is any indication, it may take a move up towards 13200, high marks set during spring of 2018, before a capper is put in.
There are lines running overhead to take into consideration, and could prevent the DAX from getting to loftier levels at an accelerated rate, keeping the pace in line with the recent grind higher. There is an upper parallel just ahead that is connected to the trend-line off the August low, and then there is a trend-line passing over from peaks set in May and July.
The extended nature of the market into resistance coupled with a persistent bid for stocks makes this a difficult spot for traders. Those who have longs from good prices may want to consider seeing if the rally can continue to extend, while new longs don't hold much risk/reward appeal. Would-be shorts may be prudent to hold tight until we see bearish price action suggests the rise wants to reverse, even if for only a pullback towards the July high near 12650.
For now, the sidelines are an attractive spot until things line up a bit better.
DAX 30 Daily Chart (extended but could continue to grind higher)
CAC breaking out above wedge resistance
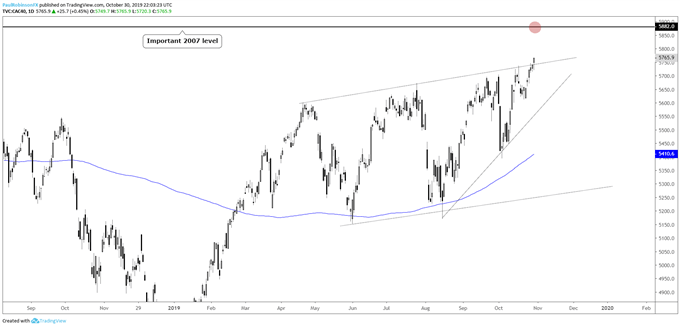
The CAC is above the top-side trend-line of the wedging formation in place over the past few months. This suggests that higher prices may be in store in the days ahead. The next level of resistance to eye is one from way back in 2007, 5882; it was a swing-high that made an important lower-high before the rout took place in 2008. It could prove to be formidable, so be on the watch-out for volatility soon should the level get tested. The top of the wedge is now considered support on weakness.
CAC 40 Daily Chart (above top-side t-line, wedge)

Want to learn more about trading the DAX? Check out ‘How to Trade the DAX’, and join me weekly for technical updates in the Indices and Commodities webinar.
Forex & CFD Trader Resources
Whether you are a new or experienced trader, we have several resources available to help you; indicator for tracking trader sentiment, quarterly trading forecasts, analytical and educational webinars held daily, trading guides to help you improve trading performance, and one specifically for those who are new to forex.
---Written by Paul Robinson, Market Analyst
You can follow Paul on Twitter at @PaulRobinsonFX


