


DAX 30/CAC 40 Technical Highlights
- DAX pushing higher out of short-term H&S towards gap-fill
- CAC running up against a couple of degrees of resistance
For fundamental and technical forecasts, trade ideas, and educational guides, check out the DailyFX Trading Guides page.
DAX pushing higher out of short-term H&S towards gap-fill
The DAX continues to push higher out of the inverse head-and-shoulders (H&S) pattern we discussed last week. This could continue to be bullish for the index for a little while longer, with the August 2 gap-fill not too far ahead at 12253.
But even though the near-term picture is bullish and the rally off the lows has taken the DAX a good distance higher since last month’s low, the broader outlook may still be quite bearish. A larger, traditional type of H&S formation is still on the table.
A turn down soon will fill out the right shoulder. A development that isn’t yet mature enough to act on, but a scenario worth keeping a watch on. At the moment, the DAX is still trading with a mildly bullish tone.
DAX 30 Daily Chart (watch the gap)

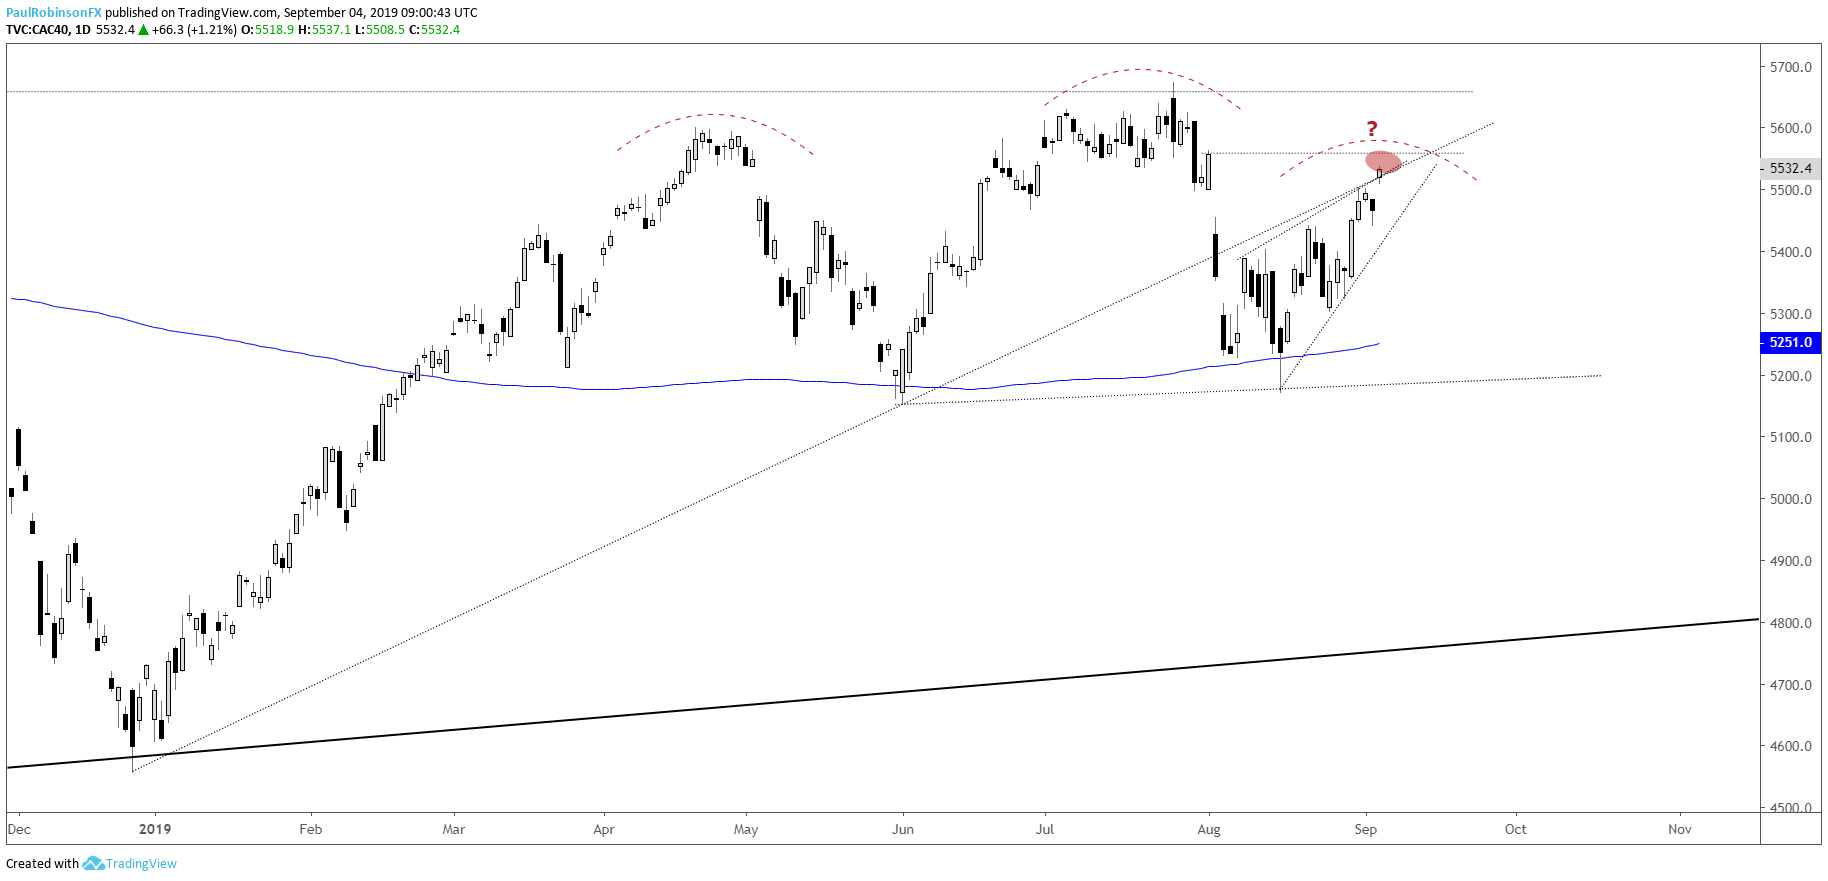
CAC running up against a couple of degrees of resistance
The CAC is arriving at a very interesting spot on the charts. The rise has been a choppy one, with lots of overlap in price action, but nevertheless it has kept the French index moving higher. It’s currently trading at the underside of the December trend-line not too far from a full gap-fill up to 5557.
We could soon see the CAC turn down and break the underside trend-line of a wedging formation that embodies the choppy trade. A rejection from resistance and break of the wedge could mark an important sequence, as the right shoulder of a broad H&S pattern would start to become visible.
CAC 40 Daily Chart (rising into resistance)
Want to learn more about trading the DAX? Check out ‘How to Trade the DAX’, and join me weekly for technical updates in the Indices and Commodities webinar.
Forex & CFD Trader Resources
Whether you are a new or experienced trader, we have several resources available to help you; indicator for tracking trader sentiment, quarterly trading forecasts, analytical and educational webinars held daily, trading guides to help you improve trading performance, and one specifically for those who are new to forex.
---Written by Paul Robinson, Market Analyst
You can follow Paul on Twitter at @PaulRobinsonFX


