


DAX 30/ CAC Technical Highlights
- DAX trading below H&S neckline, moving towards 2011 trend-line
- Gap below support has CAC at risk or more selling
For the intermediate-term fundamental and technical outlook for the DAX & Euro, check out the Q4 Trading Forecasts.
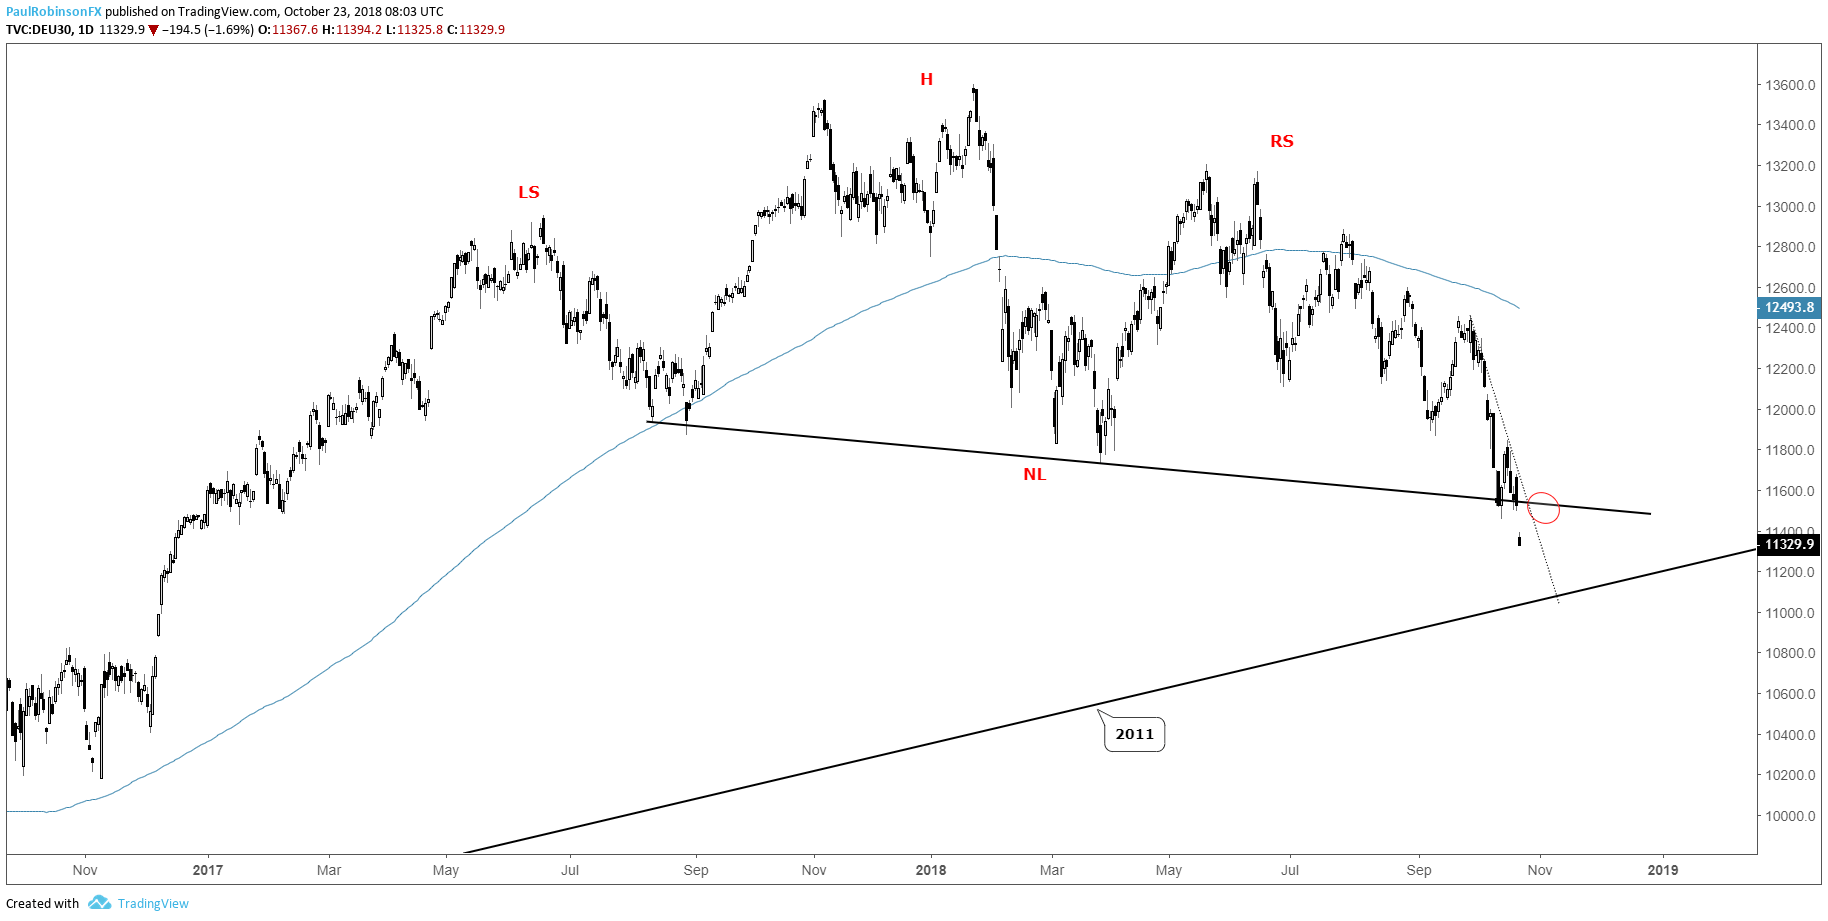
DAX trading below H&S neckline, moving towards 2011 trend-line
Today’s gap-down has the DAX trading below the neckline of the head-and-shoulders top under construction since June of last year. Given its sheer size a weekly close below the neckline is viewed as best for confirmation, and for now pressure is on the market to try and recover back above.
First up on any bounce from here is the neckline, a line of support now turned resistance. It could offer a nice spot from a risk/reward perspective for would-be shorts to initiate new positions, and those already in a short a threshold to use for managing their positions.
In the absence of a recovery above the neckline, the next major level arrives at the 2011 trend-line. This is viewed as effectively the last line of defense for big-picture longs as beyond the long-term trend-line there isn’t much preventing the market from trading much lower in the weeks and months ahead.
For market sentiment and to learn more about how to use it in your analysis, check out the IG Client Sentiment page.
DAX Daily Chart (neckline support broken)
DAX Weekly Chart (H&S top)

Gap below support has CAC at risk or more selling
The CAC may be oversold by some metrics, but the gap beneath lows seen earlier in the year and the worst close since August 2017 has the index set up for more selling. A recovery bounce may be in store, but a move into the 5050-area is seen as a risk of proving short-lived.
Given the significant slow-motion topping process since May of last year, lower-lows below the two big swing-lows apart of the topping process is considered an important event for the CAC just as breaking the neckline is for the DAX. A weekly close at current or worse levels will have in focus the 2011 trend-line currently near 4700.
CAC Daily Chart (Breaking down below support)

Want to learn more about trading the DAX? Check out ‘How to Trade the DAX’, and join me weekly for technical updates in the Indices and Commodities webinar.
Forex & CFD Trader Resources
Whether you are a new or experienced trader, we have several resources available to help you; indicator for tracking trader sentiment, quarterly trading forecasts, analytical and educational webinars held daily, trading guides to help you improve trading performance, and one specifically for those who are new to forex.
---Written by Paul Robinson, Market Analyst
You can follow Paul on Twitter at @PaulRobinsonFX


