DAX/CAC Technical Highlights:
- DAX has trend-line, 200-day ahead as resistance
- CAC staring down trend-line off May high
- Price action could further squeeze on a turn lower
For the intermediate-term fundamental and technical outlook for the DAX & Euro, check out the DailyFX Q3 Forecasts.
DAX and CAC both face obstacles, weakness will tighten up price pattern
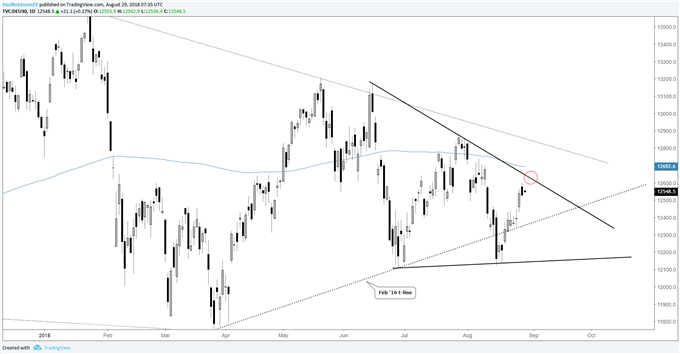
In recent sessions the DAX reclaimed the broken February 2016 trend-line with the help of stable risk appetite. The recapturing of significant trend support doesn’t have the market sitting in good shape, though, it’s just that it’s not in poor shape. Getting a handle on the DAX hasn’t been easy, but with a turn lower and a little more time that could change.
The trend-line running down off the June high could make up the top-side line of a descending wedge should we see the DAX trade lower in the days/weeks ahead. The pattern is about 2/3rd the way through, with the bottom of the formation arriving via a relatively flat bottom running over from the low in June under the current month low.
The descending nature of the formation and the fact that German equities are lagging behind the U.S. hints at an eventual breakdown, but we’ll need to reserve further judgment until we have more information to work with. For now, trend-line resistance and the 200-day stand in the way of a larger advance. We’ll play it slowly until market participation comes back and activity picks up as the fall quickly closes in…
DAX Daily Chart (T-line ahead, wedge forming)

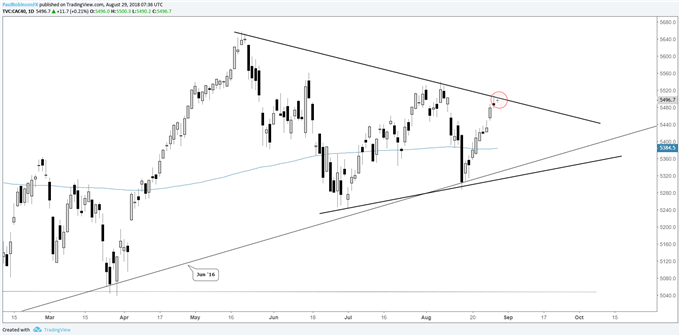
Naturally, the CAC chart resembles its German counterpart, but with modestly stronger posturing. Yesterday, the market posted a reversal bar off the top-side trend-line of what could constitute the upper line of the symmetrical triangle. The bottom of the triangle has the trend-line from June 2016 running up through it. In the days ahead, weakness is seen as the risk given overhead resistance and yesterday’s reaction to it. With more time we should gain clarity on which way a coiling market may want to break.
For market sentiment and to learn more about how to use it in your analysis, check out the IG Client Sentiment page.
CAC Daily Chart (T-line, triangle forming)

For live weekly updates on the DAX and other indices, join me live on Tuesdays for ‘Indices and Commodities for the Active Trader’.
Forex & CFD Trader Resources
Whether you are a new or experienced trader, we have several resources available to help you; indicator for tracking trader sentiment, quarterly trading forecasts, analytical and educational webinars held daily, trading guides to help you improve trading performance, and one specifically for those who are new to forex.
---Written by Paul Robinson, Market Analyst
You can follow Paul on Twitter at @PaulRobinsonFX


