


DAX Technical Highlights:
- DAX drops down to long-term trend support
- Bottom and top-side t-lines converging/H&S potential
- Price action not giving good cues in the near-term
For the intermediate-term fundamental and technical outlook for the DAX & Euro, check out the DailyFX Q3 Forecasts.
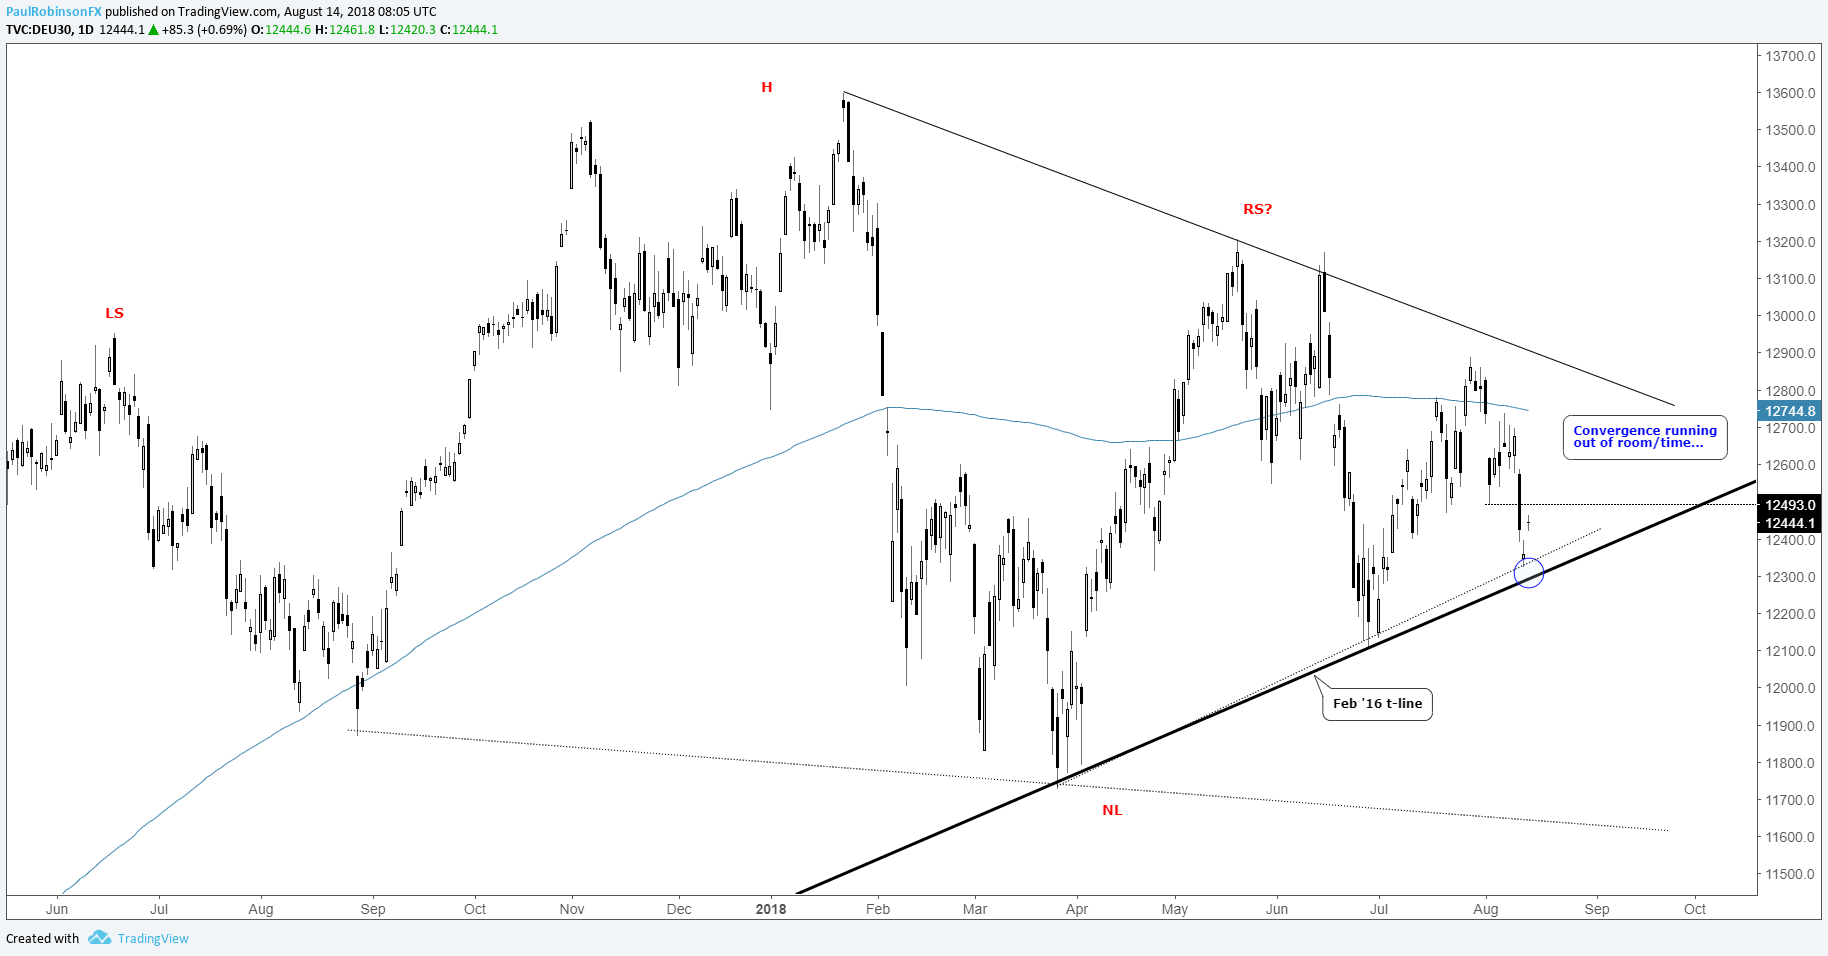
In last week’s DAX tech update, we were focused on a technical formation on the hourly chart which suggested near-term weakness. The target on a down-move was the February 2016 trend-line, and as it turned out, as far as we’re concerned given the long-term nature of the line, the line was tested. The test wasn’t a thorough one, but long-term levels need to be given a small buffer around them. These lines should be drawn with a crayon and not a fine-point pen.
So, what could be next? In the short-term, we will give support the benefit of the doubt as per usual. On the top-side, though, things are getting bunched up a bit with the convergence of the aforementioned long-term trend-line and the one running down off the record high. The convergence in price action since January suggests a big move is coming relatively soon (next ~6 weeks, just in time for one of the busiest times of the year).
One big-picture possibility, still, is for the developing head-and-shoulders dating back to June of last year to trigger. Its symmetry is coming into question given how far out the right side of the pattern is extending, but should the neckline break in the not-too-distant future it could still. This would first require a break below the Feb ’16 trend-line, followed by a break below roughly 11600. It’s not an immediate concern, so we’ll revisit it later should it become a relevant scenario.
In the short-term, it’s a tricky spot as shorts aren’t appealing with big support right at hand while longs have a bit of a headwind to contend with as price action thus far hasn’t been too reactive to the top-side (maybe a better test of the Feb ’16 t-line will change this.
So far this month, we’ve seen the FX market fly around but the same headlines hitting currencies haven’t impacted indices too much. This could change, but if things settle out across the board there may be a lull from now into September as this time of the year can be a relatively dull one. But don’t lose your focus if trading these markets, as we’ve seen in the past week things can heat up quickly.
For market sentiment and to learn more about how to use it in your analysis, check out the IG Client Sentiment page.
DAX Daily Chart (Feb '16 t-line)
For live weekly updates on the DAX and other indices, join me live on Tuesdays for ‘Indices and Commodities for the Active Trader’.
Forex & CFD Trader Resources
Whether you are a new or experienced trader, we have several resources available to help you; indicator for tracking trader sentiment, quarterly trading forecasts, analytical and educational webinars held daily, trading guides to help you improve trading performance, and one specifically for those who are new to forex.
---Written by Paul Robinson, Market Analyst
You can follow Paul on Twitter at @PaulRobinsonFX


