


DAX Technical Highlights:
- DAX bounce is coming from successful hold of Feb ’16 t-line
- Testing a big area now in the 12550/600 region
- Big-picture H&S pattern still on the table
For the intermediate-term fundamental and technical outlook for the DAX & Euro, check out the DailyFX Q3 Forecasts.
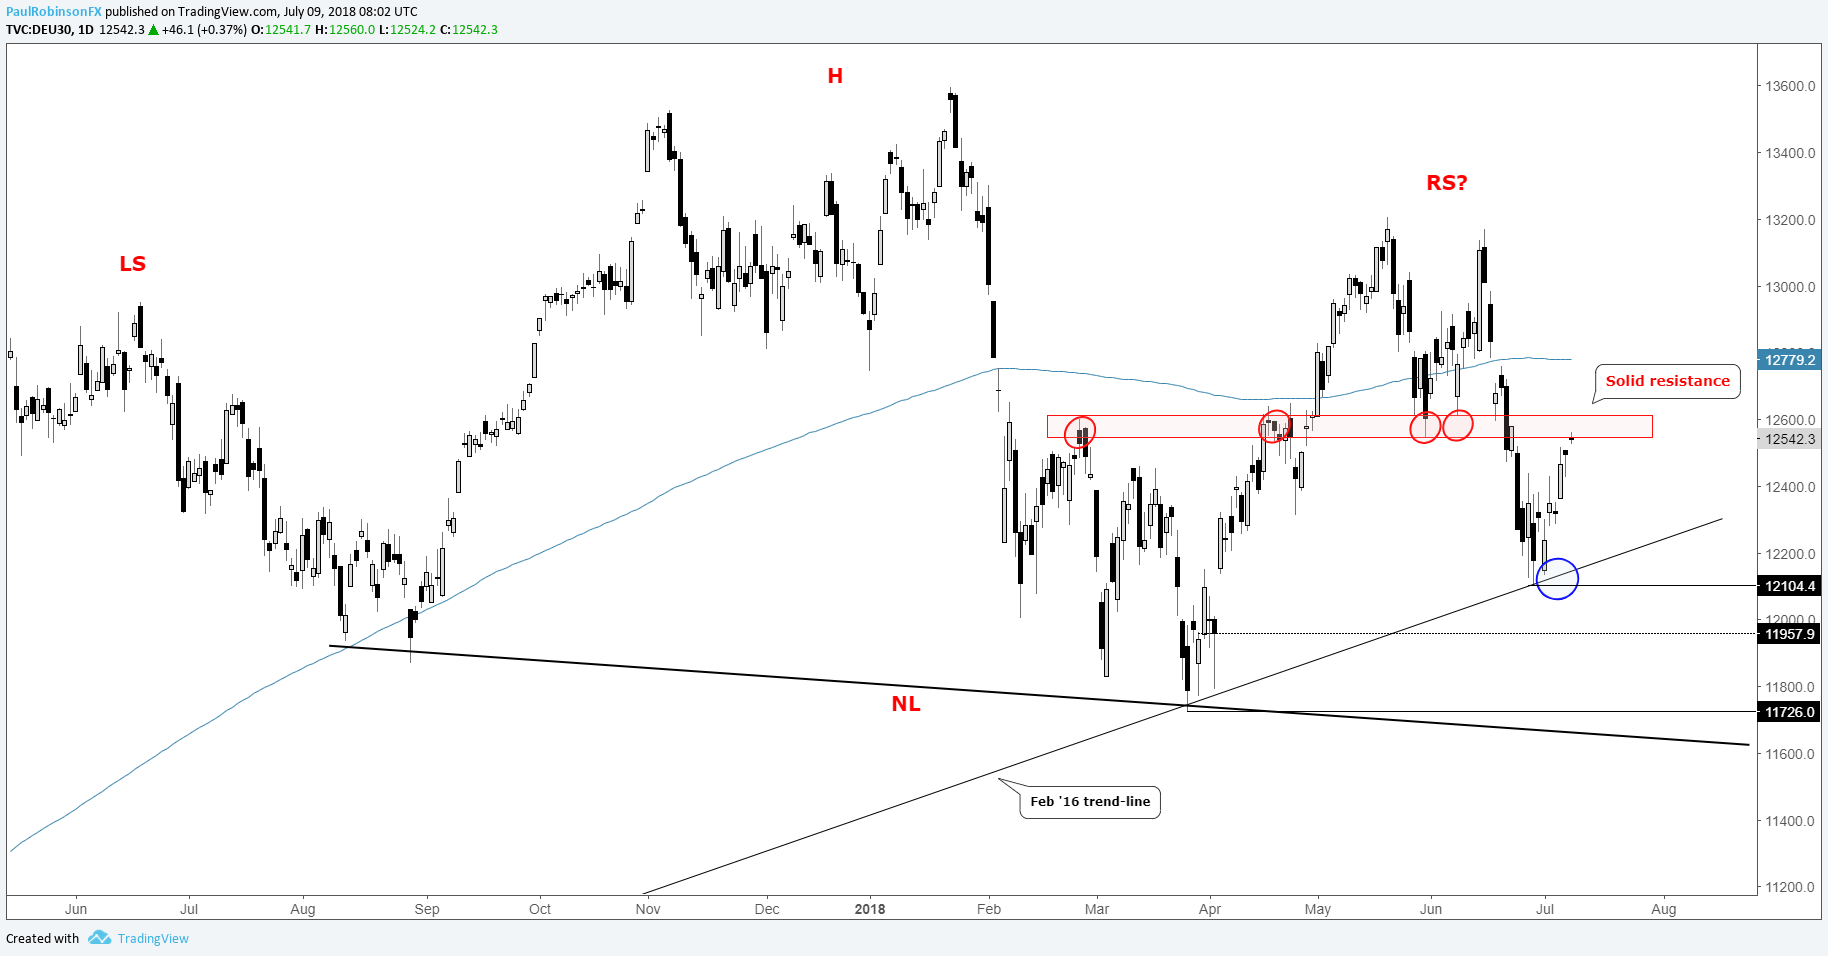
The DAX is undergoing a strong bounce since last week from sizable trend support via the February 2016 trend-line. Current strength has the index squarely up against strong resistance in the vicinity of 12550/610. How it reacts here will be important for the short-term and possibly the longer-term as well.
First off, from a short-term strategic standpoint, would-be shorts are offered a solid backstop from which to look for the market to turn down and assess risk (stops placed above resistance should momentum reverse). Fresh longs at this juncture are at risk, as it’s not prudent to buy into resistance. Existing longs who remain firmly bullish may want to see how things play out here first before bailing. But caution is warranted.
Dialing back to the big-picture, as we’ve been discussing in recent posts, there is a macro head-and-shoulders pattern gaining traction. Ideally, we don’t see too much more time elapse while carving out the right shoulder, if it is to come to fruition.
How the DAX plays out around current resistance could be crucial to the long-term implications of the H&S pattern. A big push through could threaten the integrity of the right shoulder (RS), while a turn down soon could have the Feb 2016 trend-line under pressure. A break of big trend support is likely to bring with it a thorough test of the neckline. We’ll discuss the longer-term implications of the pattern in further detail should it become relevant.
For now, focus is on the 12550/600 region and whether the DAX can push through or not. A rejection will give short-term shorts the upper hand, while a break through could extend the game for longs, at least for a little while longer.
Check out this guide to learn 4 core tenets for Building Confidence in Trading.
DAX Daily Chart (Testing strong resistance)
For live weekly updates on the DAX and other indices, join me live on Tuesdays for ‘Indices and Commodities for the Active Trader’.
Forex & CFD Trader Resources
Whether you are a new or experienced trader, we have several resources available to help you; indicator for tracking trader sentiment, quarterly trading forecasts, analytical and educational webinars held daily, trading guides to help you improve trading performance, and one specifically for those who are new to forex.
---Written by Paul Robinson, Market Analyst
You can follow Paul on Twitter at @PaulRobinsonFX


