


DAX Technical Highlights:
- February 2016 trend-line holding for now, but…
- If it breaks, big neckline test could quickly be in order
- Neckline break would spell big trouble for the DAX
For the intermediate-term fundamental and technical outlook for the DAX & Euro, check out the DailyFX Q3 Forecasts.
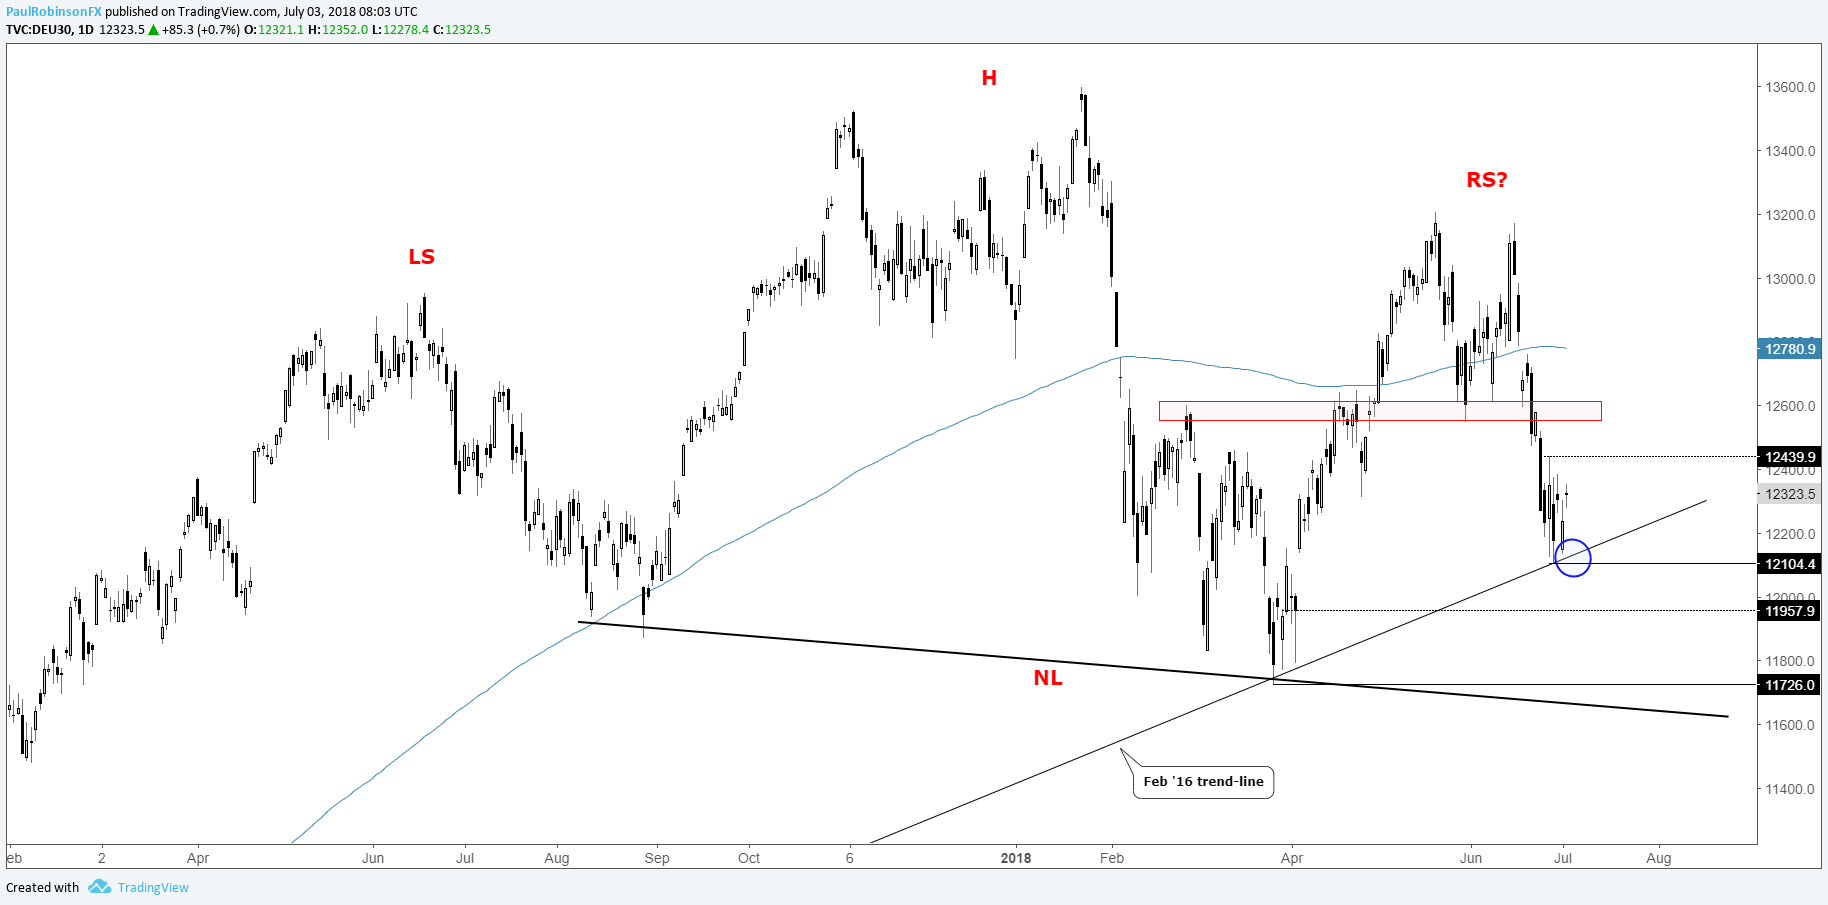
Last week, then again yesterday, the DAX tested the trend-line rising up from the February 2016 low. This trend-line might sound familiar for those of you who regularly follow global indices. It’s considered a very important threshold for the S&P 500 (which it is trading just above now). This trend-line starts at the end of the last significant correction of the bull market dating back to March 2009. It’s been tested numerous times over the past two-and-half years in both the U.S. and German benchmark.
A break of trend-line support won’t necessarily usher in massive selling just yet, though. But it would put the DAX in position to test the neckline of the head-and-shoulders pattern now spanning a period just over a year. A year-long topping process is nothing to take lightly, as its implications are for a substantial bear market decline, perhaps nearing another 20% or so from the time it breaks the neckline (which isn't until ~11650).
DAX Weekly Chart (Head-and-shoulders )

However, before we go drawing any further conclusions, we’ll give trend-line support the benefit of the doubt until broken. A close below and 12104 will be needed before more selling can kick in, but if we see these thresholds broken then look for a gap-fill first down to 11958, then a test of the March low and ultra-critical neckline.
On the top-side, if the DAX can get into gear, the first level to watch is 12440, followed by an important zone from around 12550 up into the low-12600s. It’s possible if summer trading conditions begin to dominate trade that we see the market bobble around between the 2016 trend-line and 12550/600s area.
All-in-all, the thinking is that we are in for a big test soon, but if that doesn’t materialize we may be in for a summer lull. The next couple of weeks is viewed as a potentially very pivotal period.
Check out these 4 core tenets for Building Confidence in Trading.
DAX Daily Chart (near 2016 t-line, neckline in view)
For live weekly updates on the DAX and other indices, join me live on Tuesdays for ‘Indices and Commodities for the Active Trader’.
Forex & CFD Trader Resources
Whether you are a new or experienced trader, we have several resources available to help you; indicator for tracking trader sentiment, quarterly trading forecasts, analytical and educational webinars held daily, trading guides to help you improve trading performance, and one specifically for those who are new to forex.
---Written by Paul Robinson, Market Analyst
You can follow Paul on Twitter at @PaulRobinsonFX


