


DAX/CAC Technical Highlights:
- Euro weakness a boon amidst firming global risk appetite
- DAX clears above resistance zone, has trend-line support too
- CAC at fresh decade+ closing highs
Check out the DailyFX Q2 Forecasts for the DAX, Euro, and other major markets; also see how our Trading Opportunities for are 2018 are performing – DailyFX Trading Guides.
Euro weakness a boon amidst firming global risk appetite
Since March, we’ve seen euro weakness help provide a strong tailwind for Euro-zone equities as general global risk appetite firmed up. The one-month correlation between EURUSD and the DAX and CAC, respectively, is -82% and -95%. Both figures have strong statistical significance, especially the latter which indicates the French benchmark and single-currency are trading nearly 1-to-1 in opposite directions.
While we don’t typically focus so much on currency/index correlations in our analysis for determining direction in the specific indices, it’s worth noting when it becomes this prevalent for a couple of reasons.
One, if there is strong conviction in what the currency may be on the verge of doing, then one can make deductions when analyzing the index (or even vice versa). (There is reason to believe the euro is headed lower once oversold conditions are worked off.) However, it’s worth heeding caution when doing this, as correlations have a tendency to change without warning.
The second, and on this end the most important reason to understand these relationships for short-term trading, is for risk management purposes. If you are trading highly correlated markets (or inversely correlated, in this case), then it is prudent to understand how your positions can interact with one another.
For example, in regards to Euro-zone indices and the euro, holding positions in opposite directions at this time is in essence the same as holding one larger directional trade. As said before, the relationship can of course change without notice, but it’s better to play it safe and respect the correlation.
On the other hand, if holding positions in the same direction, then one could be more relaxed about splitting the size up on the two trades; but, again, keep in mind that the relationship can change.
See this guide for 4 ideas on how to Build Confidence in Trading.
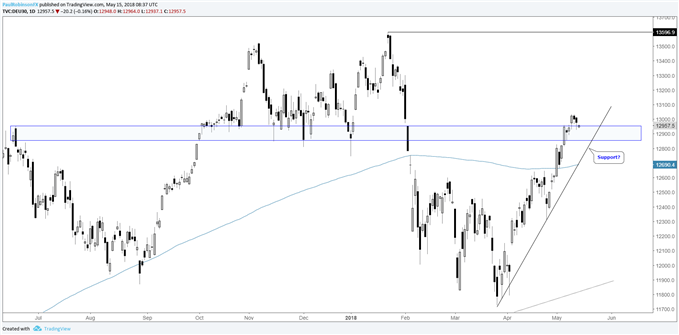
DAX clears above resistance zone, has trend-line support too
The DAX recently broke above the 12850/950 zone, which has this area now a potential source of support, along with the trend-line rising up from the March low. The market is extended, but could be amidst a period of consolidation. A move into the trend-line while sitting in the support zone could provide a decent spot to look for fresh long positions.
A decline below both forms of support would be reason to back off from this notion. If the broader topping formation we recently discussed is to come to fruition, then we’ll need to see a breakdown of support happen relatively soon. For now, we’ll respect the current climb higher and support below.
DAX Daily Chart
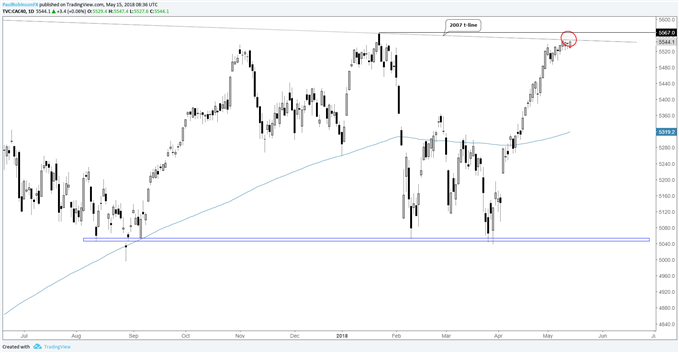
CAC at fresh decade+ closing highs
The CAC, as noted earlier, is benefiting the most from a weak euro. The index has erased all of its losses experienced from earlier in the year and recently closed at its best levels since 2007.
There is a trend-line from over 10 years ago that it is currently trading at, but given the distance between the first and second point to the recent touch, it’s questionable from a symmetry standpoint how much impact the trend-line will have.
A breakout above 5567 will have the CAC trading at its highest level since 2007 on an intra-day basis, as well. Price action has become sluggish lately, so momentum might be running low on the extended index. Overall, while the trend remains firmly higher, risk/reward for fresh longs isn’t favorable at this time. Shorts still hold risk until we see a firm rejection.
CAC Daily Chart
Forex & CFD Trader Resources
Whether you are a new or experienced trader, we have several resources available to help you; indicator for tracking trader sentiment, quarterly trading forecasts, analytical and educational webinars held daily, trading guides to help you improve trading performance, and one specifically for those who are new to forex.
---Written by Paul Robinson, Market Analyst
You can follow Paul on Twitter at @PaulRobinsonFX


