


DAX Technical Highlights:
- Bounce or beginning of a larger rally?
- Resistance to watch ahead on further strength
- Longer-term topping pattern developing?
Check out the DailyFX Q2 Forecasts for the DAX, Euro, and other major markets; see how our Trading Opportunities for are 2018 doing too – DailyFX Trading Guides.
Bounce or beginning of a larger rally?
Not long ago the DAX looked headed for another major leg lower, with it already precariously positioned and U.S. markets on the verge of a breakdown. But the U.S. held, the DAX has since been surprisingly strong. Is it just a bounce or beginning of a rally?
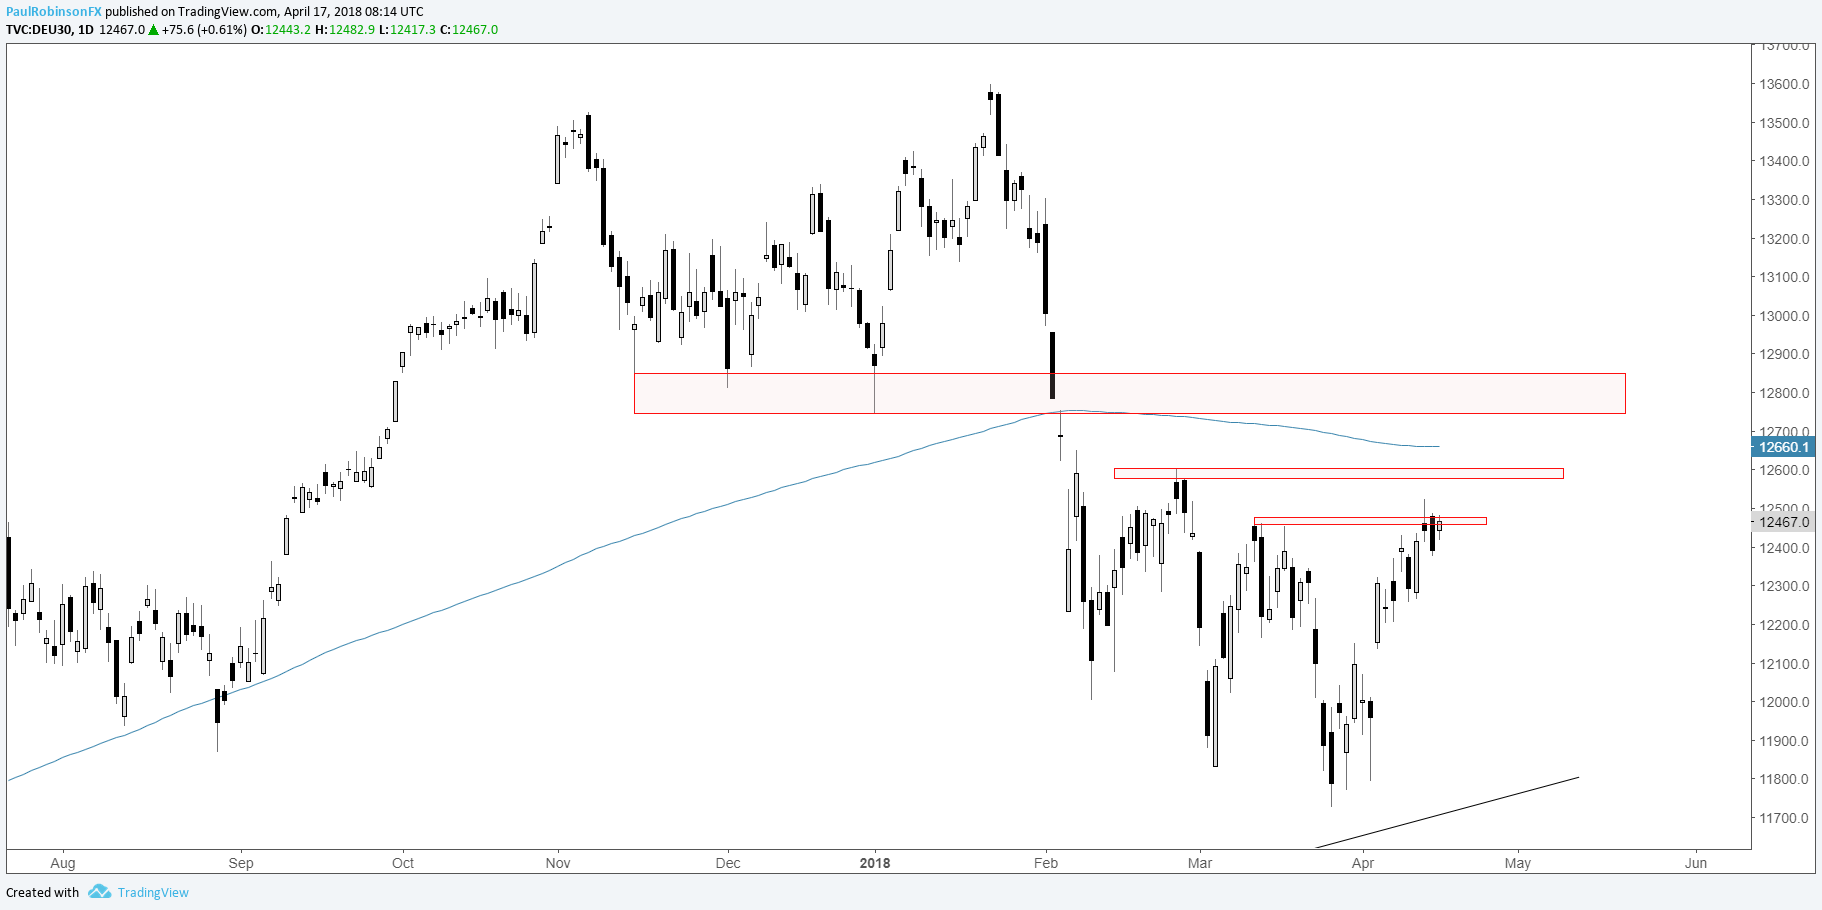
Still leaning towards a bounce, with short-term levels in focus. There are several lines/bands of resistance not far ahead to keep an eye on beyond current struggles around the mid-March swing-high. A swing-high in Feb at 12601 is first up on another push higher, followed shortly thereafter by the 200-day at 12660, then lows developed during the Nov-Jan period.
It appears one of those areas will provide reason for the DAX to pull back, at the least. How price action plays out will be what matters. We’ll be waiting for a forceful rejection before we consider sharpening our bear claws. Initially, it may only turn out to be a pullback, but…
See this guide for 4 ideas on how to Build Confidence in Trading.
DAX Daily Chart (Resistance levels to watch)
Longer-term topping pattern developing?
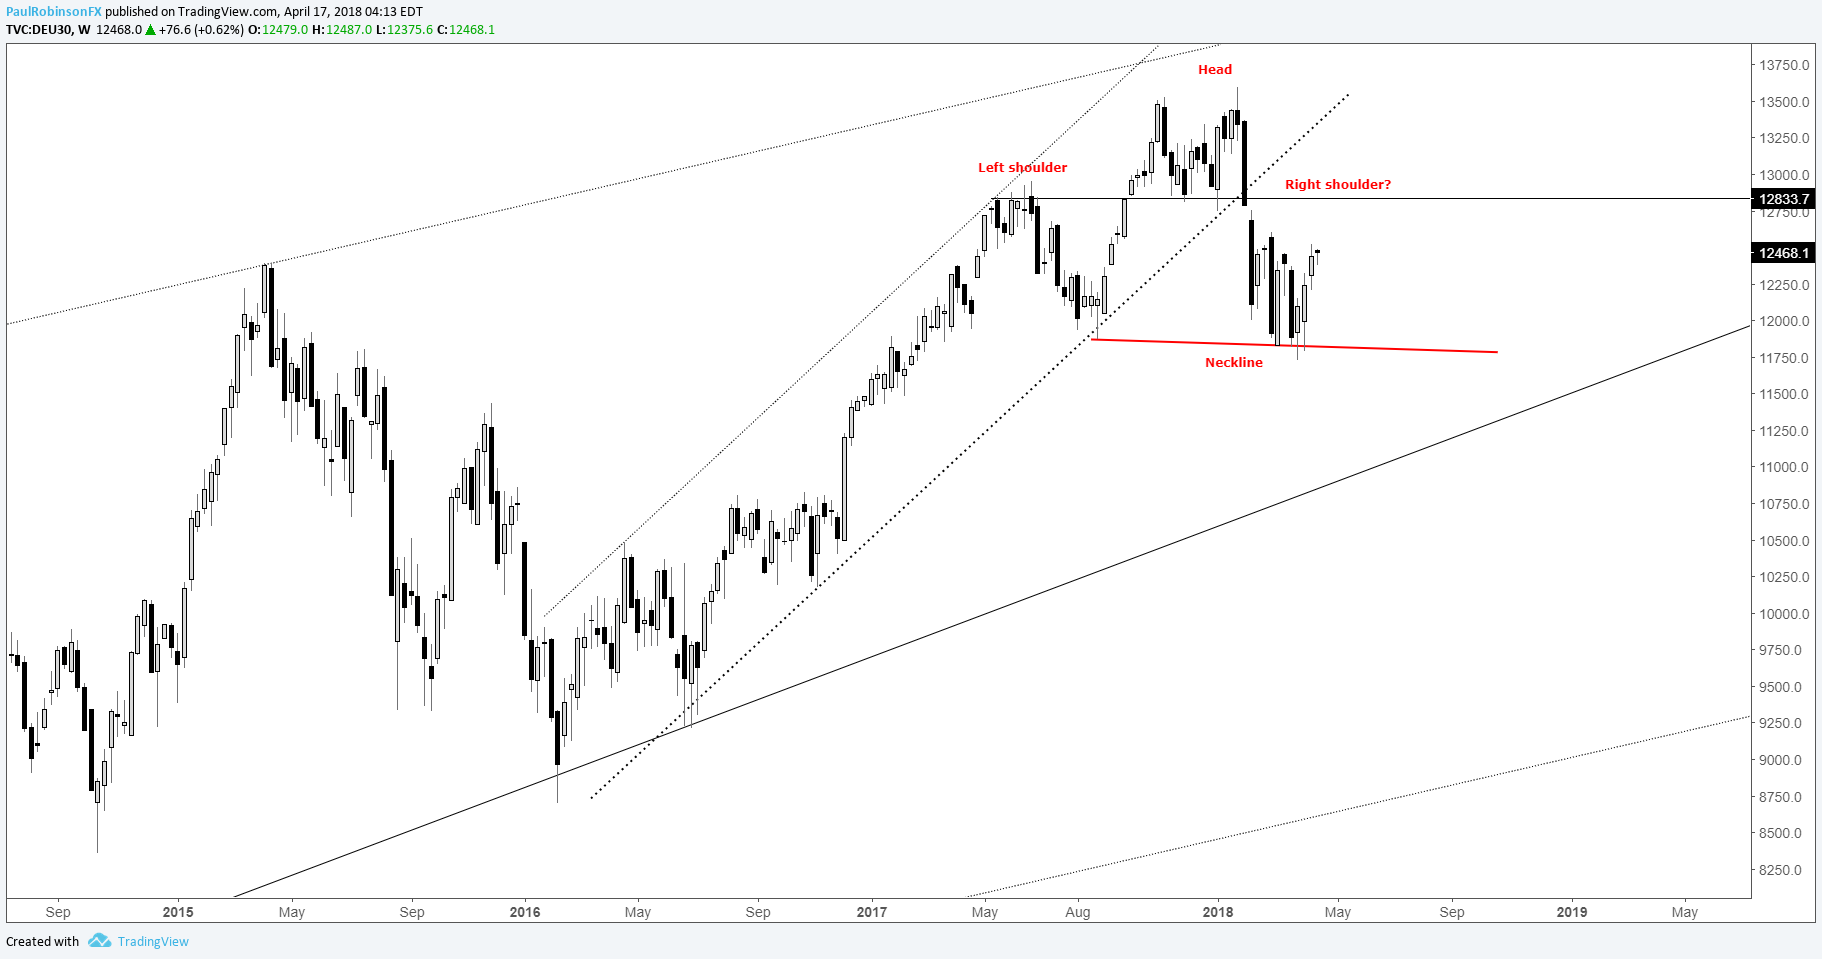
There is potential for quite the topping pattern to develop. This, of course, without it having fully matured is only a scenario, but a head-and-shoulders formation is beginning to come into view. The current period of chopping around/strength would, should it form, act as the right shoulder.
It’s too early to get too excited about its prospects, but certainly worth keeping on the backburner moving forward. Given its beginnings date back to June, the size of the pattern would imply a major decline is on the way. We’ll discuss this in further detail should it become relevant. For now, we’re focusing on levels close at hand. Don’t forget to keep an eye on the U.S. market too as a measure of general risk trends.
DAX Weekly Chart (Head-and-shoulders forming?)
Forex & CFD Trader Resources
Whether you are a new or experienced trader, we have several resources available to help you; indicator for tracking trader sentiment, quarterly trading forecasts, analytical and educational webinars held daily, trading guides to help you improve trading performance, and one specifically for those who are new to forex.
---Written by Paul Robinson, Market Analyst
To receive Paul’s analysis directly via email, please SIGN UP HERE
You can follow Paul on Twitter at @PaulRobinsonFX


