


What’s inside:
- DAX been a difficult index to get a handle on in recent trade
- Watching a couple of key technical developments in the index, but...
- The CAC 40 may be the index to focus on given the nearly completed triangle
What’s driving European stocks? Find out in our market forecasts.
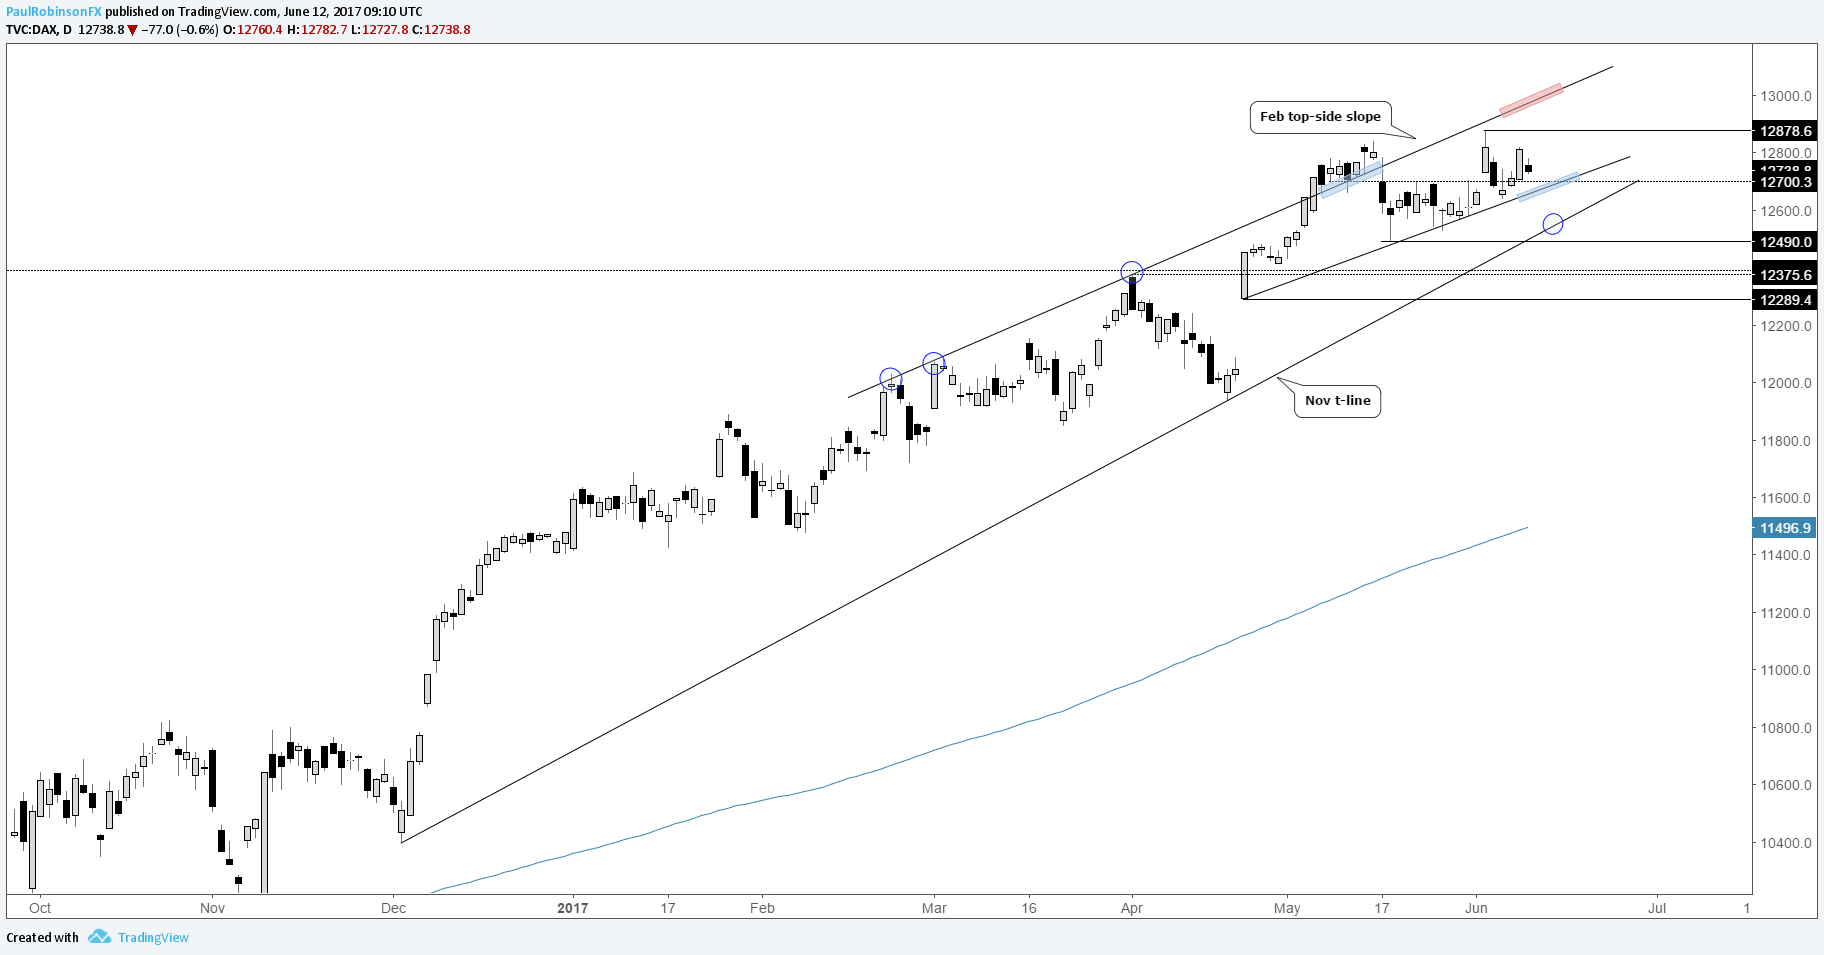
As we noted in the weekly forecast, the DAX hasn’t been a very easy index to get a handle on in the short-term. The 12700-line heading into last week was a short-term threshold viewed with importance – hold above bias remains bullish, close below and focus will shift lower. After briefly dipping below 12700 the market quickly recovered back above to keep the technical landscape intact, and choppy. Focus is now shifted towards the trend-line off the French election-day gap low as fairly important point of support. Should trend-line support break, next up is the November trend-line and May low at 12490. Aggressive selling could lead to an eventual test of the 4/24 gap. That is if it breaks (it’s support until it’s not). Should the market hold, then a neutral to bullish bias is warranted. The choppy nature of recent price action leaves us in overall limbo, and on that risk/reward isn’t favorable in either direction.
DAX: Daily
Keep an eye on the CAC 40. While typically the CAC is viewed secondary to the DAX as the latter is the larger market, we may find better directional indications in the former. The 3-month correlation between the two indices is 96%, and only has been as low as 43% in the past three years. It’s safe to say they trade together for the most part.
The French index has been in the process of carving out a solid-looking triangle. It’s leaning more descending than symmetrical, thus hinting at a possible bearish outcome, except that the trend has been strongly higher for months, which suggests the wedge may result in a continuation-move higher. The “well it could do this, or it could do that” thought is precisely why taking a ‘wait-and-see’ approach is best with these patterns. A convincing break higher above the upper trend-line puts longs into play, while a break below the lower trend-line brings shorts into focus; especially with the glaring first-round Election-gap around the corner. The November trend-line just below the 4/24 gap-day low stands in the way, but clear below there and there is room for the market to drop. Again, this is if we see a breakdown out of the triangle. On a top-side break we look for new highs above the May peak to take shape.
CAC 40: Daily

Paul conducts webinars every week from Tuesday-Friday. See the Webinar Calendar for details, and the full line-up of all upcoming live events.
---Written by Paul Robinson, Market Analyst
You can receive Paul’s analysis directly via email by signing up here.
You can follow Paul on Twitter at @PaulRobinonFX.


