


What’s inside:
- The DAX is working on breaking trend-line support
- Short-term head-and-shoulders pattern testing neckline
- Watching for confirmation, H&S could become a triangle formation
For a list of daily webinars, you can check out our calendar for details.
On Thursday, we noted that the DAX was holding a trend-line from June, but remained capped by significant resistance surrounding 10800. Today, the market is trying to make a push below trend-line support and work its way back towards lows created between 11/10 and 11/17 in the 10604/10576 vicinity.
DAX: Daily
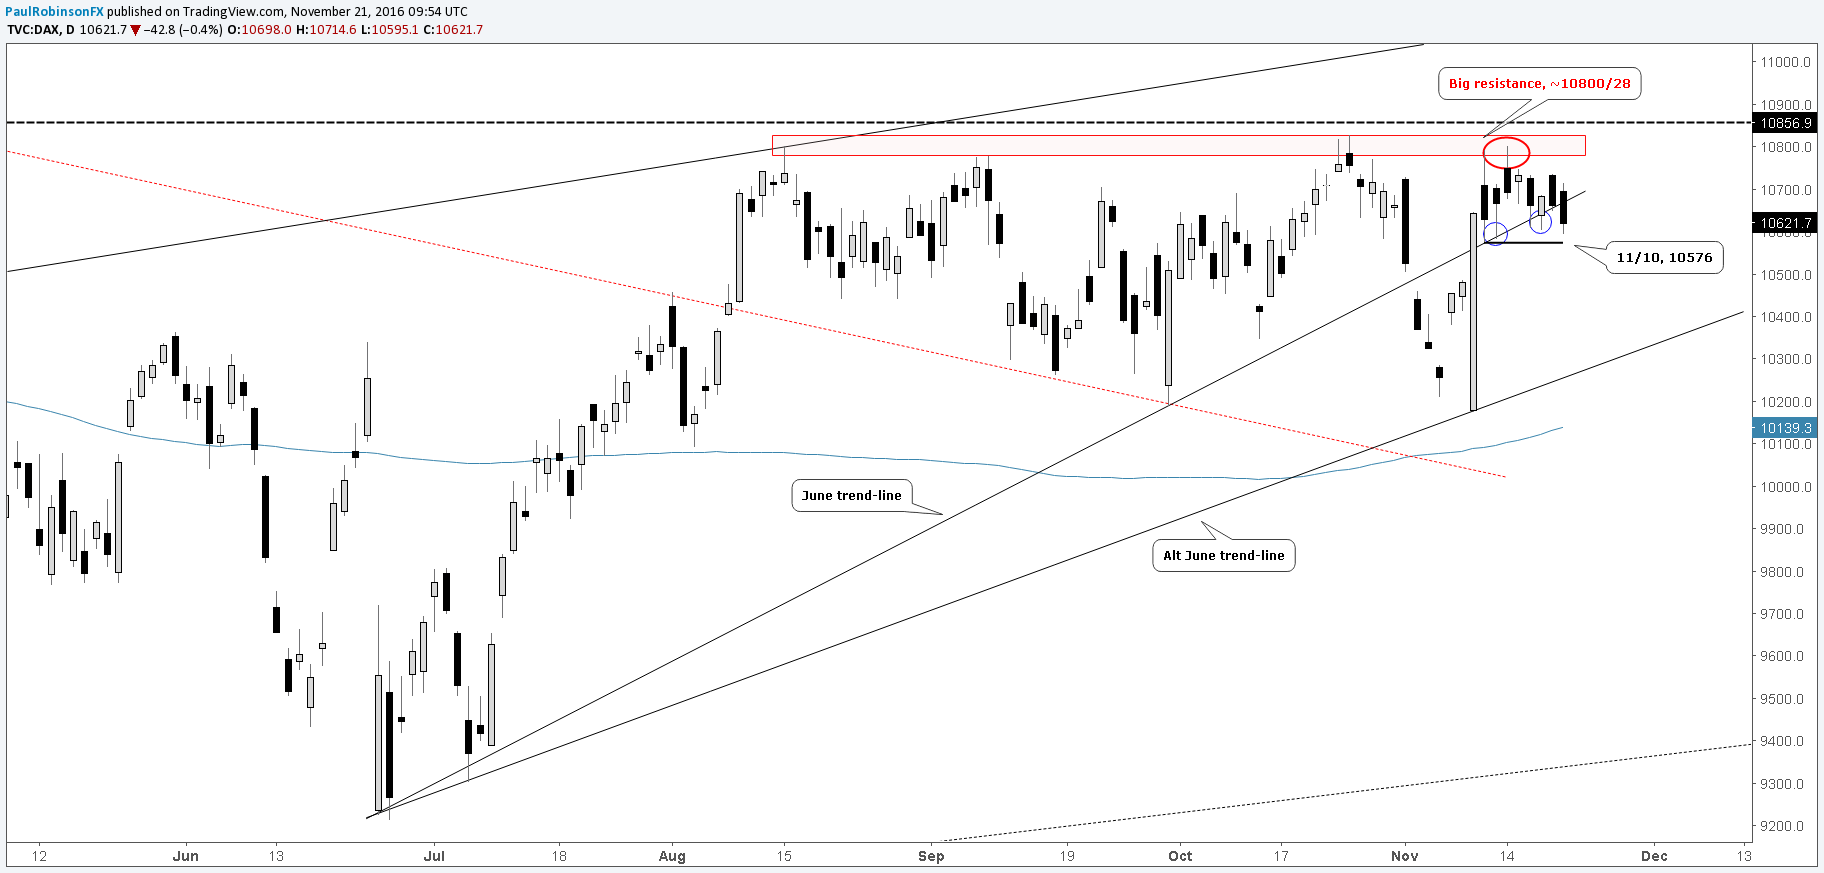
Created with Tradingview
Looking a little closer at the 60-minute chart, price action in recent sessions has been carving out a head-and-shoulders pattern, with the DAX currently challenging the neckline. A clean closing bar below the neckline on the hourly and a break of the 10604/10576 support zone would likely lead to further losses in the short-term. A measured move target, based on the height of the formation, points to a decline towards 10400. Looking back at the daily, there isn’t any significant visible support until the new June trend-line running under the massive gap lower and rip on 11/9 (caused by the US presidential election). This line currently lies at roughly 10300.
However, if short-term support holds, the H&S formation could evolve into a triangle (not an uncommon occurrence, hence one reason why it’s good practice to wait for a confirmed break.) In this event, the outcome could still lead to lower prices, but the triangle could just as well make a break for it on the top-side back into resistance at 10800. Patterns are only validated once they break.
The preferred approach on this end is to wait for a confirmed move out of a price pattern, then trade in the direction of the break once countertrend price action loses momentum. In other words, buy dips, sell rips in the direction of the trend.
DAX: 60-minute
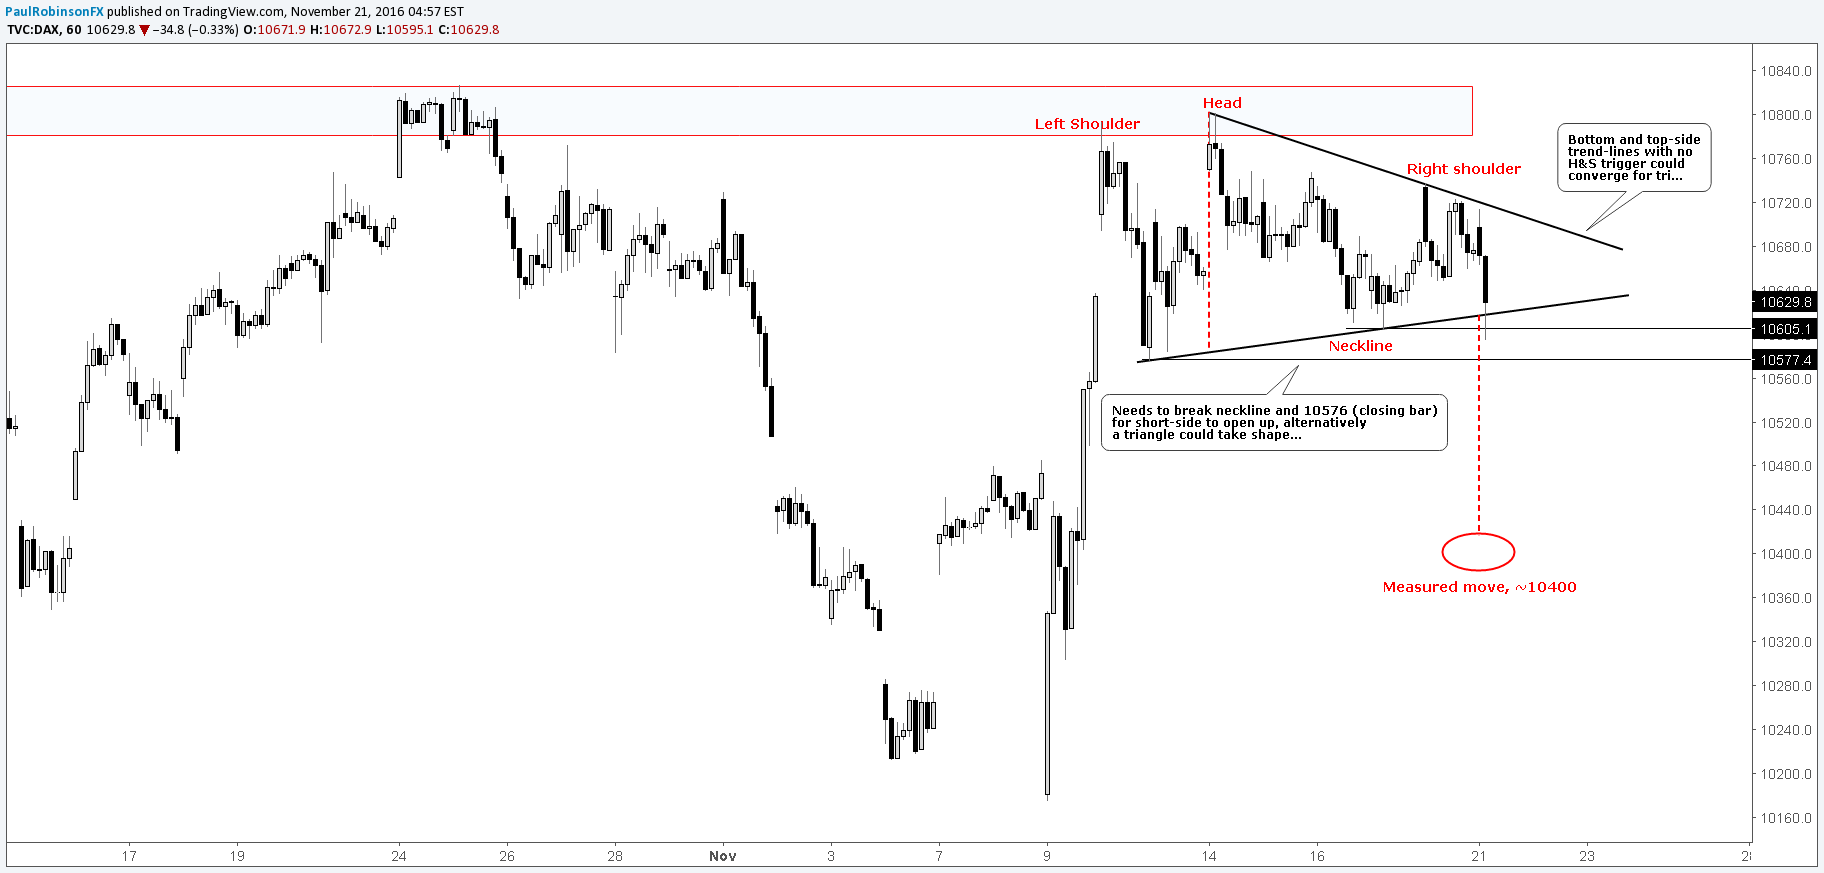
Created with Tradingview
Check out one of our several Trading Guides designed to help traders of all experience levels improve their skillsets.
---Written by Paul Robinson, Market Analyst
To receive Paul’s analysis directly via email, please sign up here.
You can follow Paul on Twitter at @PaulRobinonFX.


