GBP/USD Technical Outlook
- Cable posted a big reversal candle on the weekly last week
- Price action since suggests that reversal will lead to higher prices
GBP/USD Technical Analysis: Reversal Week Holding is Bullish
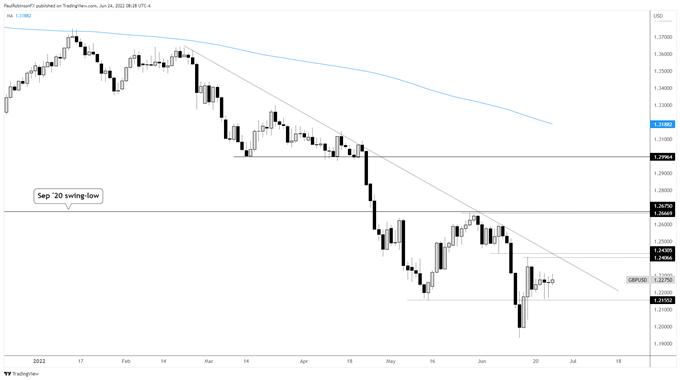
Last week cable posted a monster reversal candle on the weekly after taking out this year’s low and hitting the worst levels since March 2020. GBP/USD also briefly fell through the 1.2000 level, a big psychological level.
With the market having looked like it capitulated, along with other assets, risk trends look to have stabilized for now and are seen as being supportive of higher levels for GBP. It may not turn out to be a rip-roaring rally, but we could see price trade a few big figures higher relatively soon.
This past week the range has been quite narrow, so we should see a move develop next week. We have seen a couple of small intra-day reversals this week to the upside which is helping put in a floor. Ideally, cable stays above the weekly low at 1.1261.
A breakdown below won’t be a deal breaker, but will require than any weakness below support be short-lived for the current set-up to stay intact. To fully knock the luster off cable we would need to see a weekly close below last week’s low at 1.1933.
Looking higher, there is a fair amount of resistance ahead to climb through. The trend-line from earlier in the year coupled with last week’s high at 1.2406 could be problematic in the short-run, but if the weekly reversal is to hold true then we should see a breakout above. This could lead to a run to the May high at 1.2667.
GBP/USD Daily Chart

Resources for Forex Traders
Whether you are a new or experienced trader, we have several resources available to help you; indicator for tracking trader sentiment, quarterly trading forecasts, analytical and educational webinars held daily, trading guides to help you improve trading performance, and one specifically for those who are new to forex.
---Written by Paul Robinson, Market Analyst
You can follow Paul on Twitter at @PaulRobinsonFX


