


British Pound, GBP/USD, GBP/NZD, GBP/JPY, EUR/GBP – Talking Points:
- GBP/USD eyeing a retest of the March highs.
- RSI development hints at further gains for GBP/JPY.
- Bull Flag pattern may lead to impulsive topside move for GBP/NZD.
- Temporary relief rally on the table for EUR/GBP?

As mentioned in previous report, the British Pound has accelerated higher against its major counterparts in the first quarter of 2021, as markets priced in a faster-than-expected return to normality on the back of a highly-successfully vaccine distribution program and the diminishing prospect of additional monetary policy easing by the Bank of England.
Indeed, with the UK moving successfully to the next stage of Prime Minister Boris Johnson’s four-stage reopening plan, optimism may continue to drive the local currency higher in the coming weeks. Here are the key levels to watch for GBP/USD, GBP/JPY, GBP/NZD and EUR/GBP rates.
GBP/USD Daily Chart – Eyeing Retest of March Highs
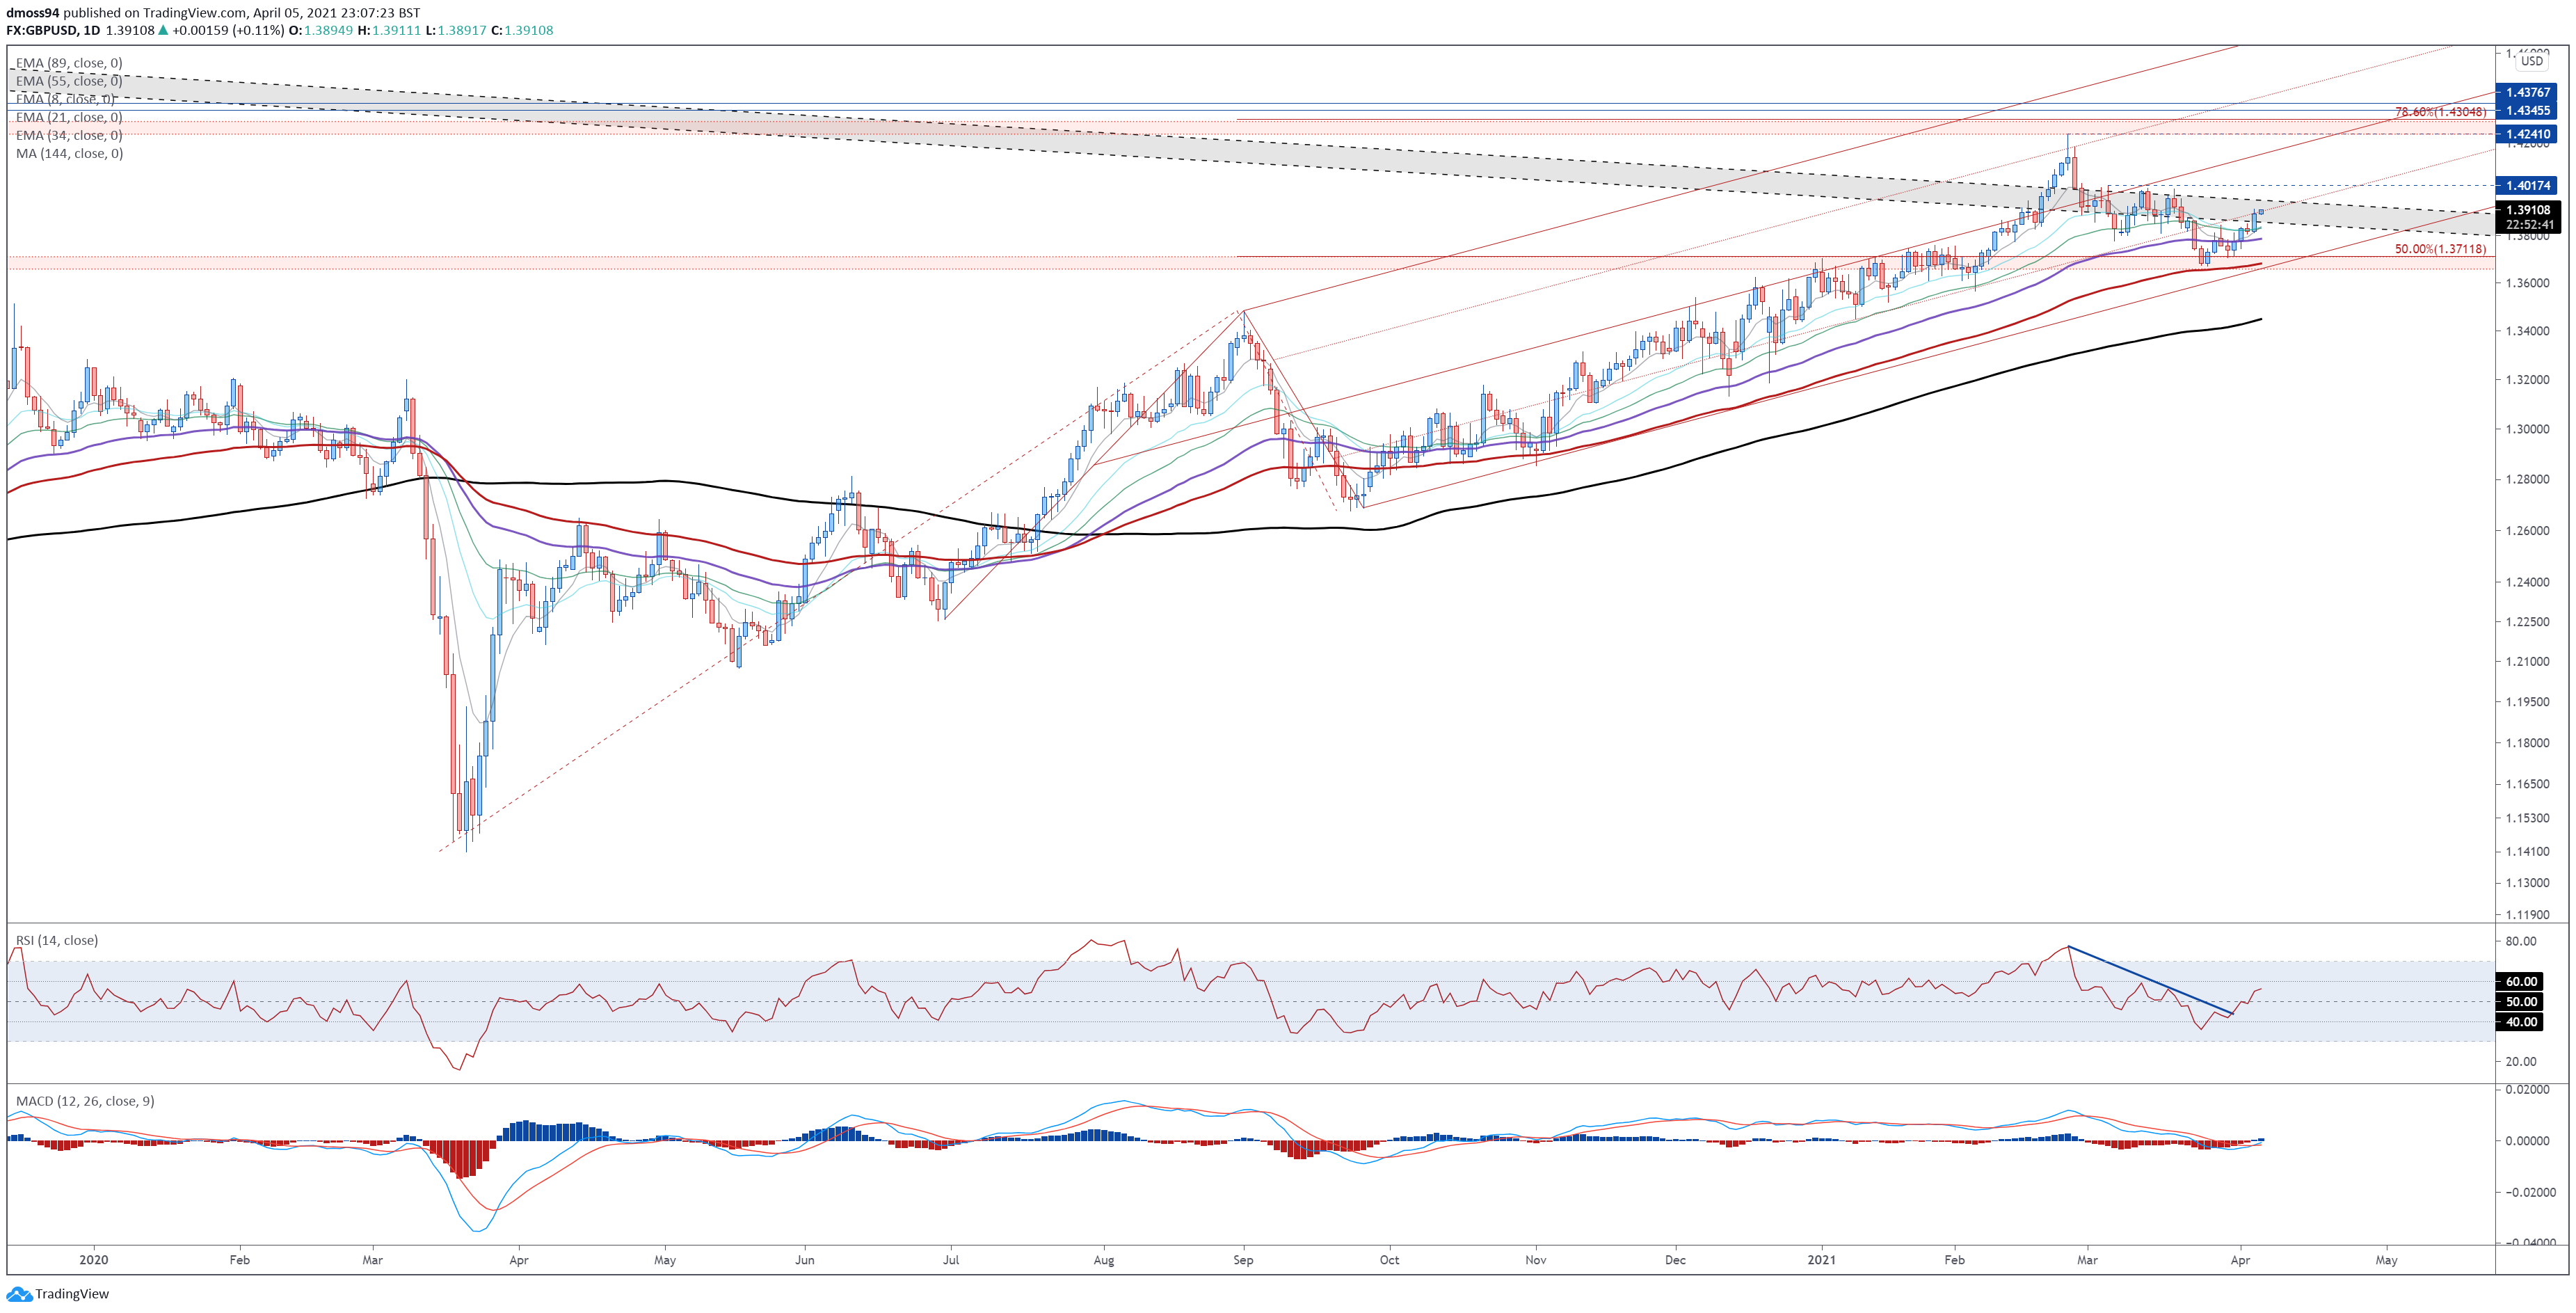
Chart prepared by Daniel Moss, created with Tradingview
The technical outlook for GBP/USD remains overtly constructive, as prices track firmly above all six moving averages and within the confines of an ascending Schiff Pitchfork.
A bullish MACD crossover, in tandem with the RSI breaking its 4-week downtrend and climbing back above its neutral midpoint, reinforces the view that the path of least resistance is higher.
If buyers can keep the exchange rate above psychological support at 1.3900, a run to retest the March high (1.4017) looks on the cards in the near term. Clearing that paves the way for prices to probe the yearly high (1.4241) set at the tail-end of February.
However, if 1.3900 gives way, a pullback to the trend-defining 55-EMA (1.3788) seems fairly likely. Breaching that brings the 50% Fibonacci (1.3712) back into the crosshairs.
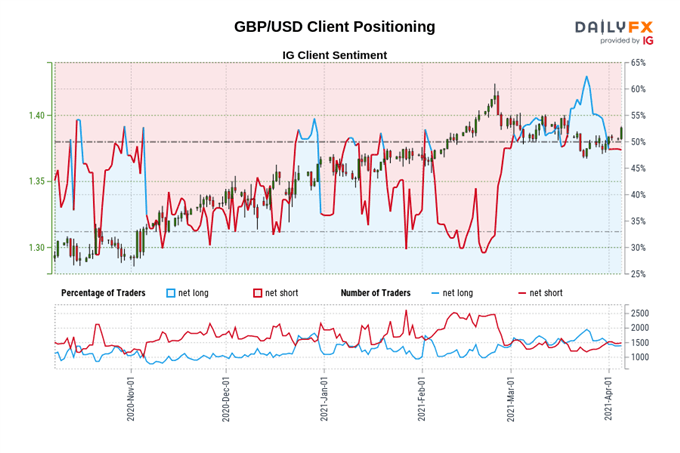
The IG Client Sentiment Report shows 48.92% of traders are net-long with the ratio of traders short to long at 1.04 to 1. The number of traders net-long is 5.08% higher than yesterday and 8.23% lower from last week, while the number of traders net-short is 3.63% higher than yesterday and 11.17% higher from last week.
We typically take a contrarian view to crowd sentiment, and the fact traders are net-short suggests GBP/USD prices may continue to rise.
Positioning is less net-short than yesterday but more net-short from last week. The combination of current sentiment and recent changes gives us a further mixed GBP/USD trading bias.
GBP/JPY Daily Chart – RSI Hints at Extended Topside Push

Chart prepared by Daniel Moss, created with Tradingview
The British Pound surged higher against the Japanese Yen after falling back to the 34-EMA for the first time this year on March 24, with the GBP/JPY exchange rate climbing 3.26%.
This impulsive topside push looks set to continue in the near term, as prices slice easily through resistance at the March 18 high (152.55) and breach the psychologically imposing 153.00 handle.
Indeed, with the MACD tracking firmly in positive territory, and the RSI drifting back into overbought territory, further gains appear in the offing.
Ultimately, if price remains constructively perched above 152.50, a test of the April 2018 high (153.85) seems inevitable. Hurdling that brings the 127.2% Fibonacci (155.08) into focus.
On the other hand, tumbling through confluent support at the March 18 high and 8-EMA could ignite a short term pullback towards psychological support at 150.00.
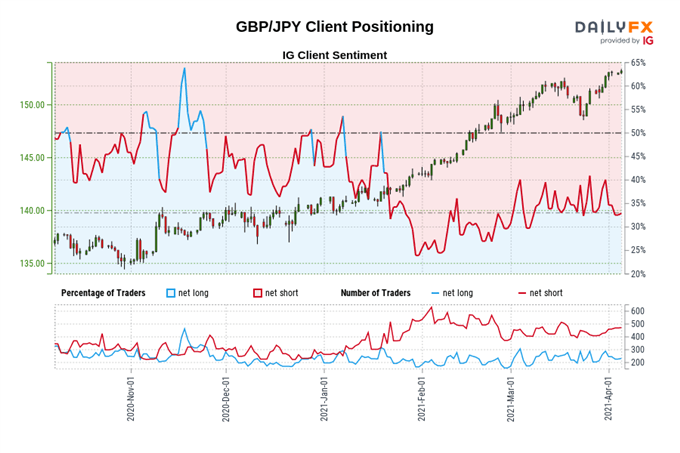
The IG Client Sentiment Report shows 34.39% of traders are net-long with the ratio of traders short to long at 1.91 to 1. The number of traders net-long is 16.07% higher than yesterday and 0.39% higher from last week, while the number of traders net-short is 6.44% higher than yesterday and 14.81% higher from last week.
We typically take a contrarian view to crowd sentiment, and the fact traders are net-short suggests GBP/JPY prices may continue to rise.
Positioning is less net-short than yesterday but more net-short from last week. The combination of current sentiment and recent changes gives us a further mixed GBP/JPY trading bias.
EUR/GBP Daily Chart – Bullish Divergence to Inspire Relief Rally?

Chart prepared by Daniel Moss, created with Tradingview
EUR/GBP rates have slid consistently lower for the majority of 2021, with the exchange rate declining as much as 5.4% year-to-date.
Further downside seems more than likely, given price has convincingly broken long-term trend support extending from the 2015 lows, and the slopes of all six moving averages notably point lower.
However, bullish RSI divergence could trigger a short-term relief rally back towards former support-turned-resistance at the 78.6% Fibonacci (0.8542). Nevertheless, if the 8-EMA (0.8515) continues to cap topside potential, a push to fresh yearly lows looks on the cards.
Breaching 0.8470 probably intensifies selling pressure and properly the exchange rate towards the 2020 low (0.8282).
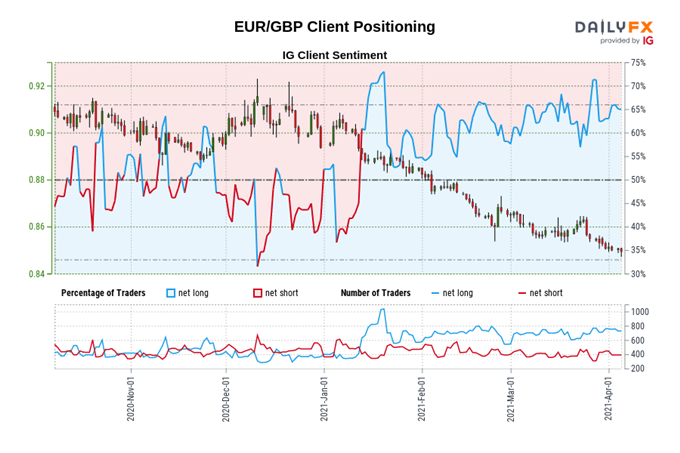
The IG Client Sentiment Report shows 62.77% of traders are net-long with the ratio of traders long to short at 1.69 to 1. The number of traders net-long is 1.19% lower than yesterday and 4.48% higher from last week, while the number of traders net-short is 13.59% higher than yesterday and 3.26% higher from last week.
We typically take a contrarian view to crowd sentiment, and the fact traders are net-long suggests EUR/GBP prices may continue to fall.
Positioning is less net-long than yesterday but more net-long from last week. The combination of current sentiment and recent changes gives us a further mixed EUR/GBP trading bias.
GBP/NZD Daily Chart – Bull Flag Signals Extended Gains at Hand

Chart prepared by Daniel Moss, created with Tradingview
GBP/NZD rates also appear poised to continue climbing higher in the coming weeks, as prices storm back above psychological resistance at 1.9500 and carve out a Bull Flag continuation pattern.
With the MACD climbing to its highest levels since September of last year, and the RSI tracking in bullish territory above 60, the path of least resistance seems skewed to the topside.
A daily close above the March high (1.9823) is needed to validate the bullish continuation pattern, with the implied measured move suggesting the exchange rate could climb to challenge the August 2020 high (1.9999).
Alternatively, capitulating below flag support (1.9589) would invalidate the pattern and could trigger a pullback to former resistance-turned-support at 1.9465.
-- Written by Daniel Moss, Analyst for DailyFX
Follow me on Twitter @DanielGMoss


