


US Dollar, AUD/USD, GBP/USD, NZD/USD, IGCS – Talking Points:
- Andrews’ Pitchfork guiding AUD/USD higher.
- GBP/USD eyeing yearly highs as price continues to track 12-month uptrend.
- NZD/USD rates consolidating above the 55-EMA. Is a push back towards the February high on the cards?
The US Dollar has clawed back lost ground against the British Pound, Australian Dollar and New Zealand Dollar in the month of March. However, this may prove to be nothing more than a counter-trend move against the prevailing trend, as all three exchange rates maintain their constructive technical outlooks. Here are the key levels to watch for AUD/NZD, GBP/USD, NZD/USD.
AUD/USD Daily Chart – Andrews’ Pitchfork Guiding Price Higher

AUD/USD daily chart created using Tradingview
AUD/USD rates have slid lower over the last few weeks, falling as much as 4.8% after surging to fresh multi-year highs at the tail-end of February.
However, this counter-trend move lower appears to be running out of steam, as price surges away from key support at the 38.2% Fibonacci (0.7619) and jumps back above all six moving averages.
Indeed, with rates continuing to track within the confines of an ascending Andrews’ Pitchfork, and the RSI bouncing back above 50, the path of least resistance seems higher.
Remaining constructively perched above 0.7700 likely opens the door for buyers to challenge the monthly high (0.7837), with a daily close above that bringing the yearly high (0.8007) into the crosshairs.
On the other hand, sliding back below 0.7700 could lead to a retest of the 38.2% Fibonacci and monthly low.
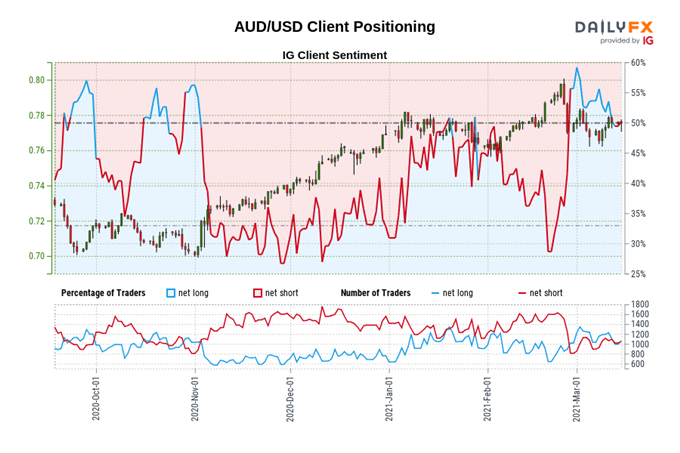
The IG Client Sentiment Report shows 49.54% of traders are net-long with the ratio of traders short to long at 1.02 to 1. The number of traders net-long is 13.51% higher than yesterday and 1.66% lower from last week, while the number of traders net-short is 12.89% higher than yesterday and 3.99% higher from last week.
We typically take a contrarian view to crowd sentiment, and the fact traders are net-short suggests AUD/USD prices may continue to rise.
Positioning is less net-short than yesterday but more net-short from last week. The combination of current sentiment and recent changes gives us a further mixed AUD/USD trading bias.
GBP/USD Daily Chart – March Uptrend Still Intact
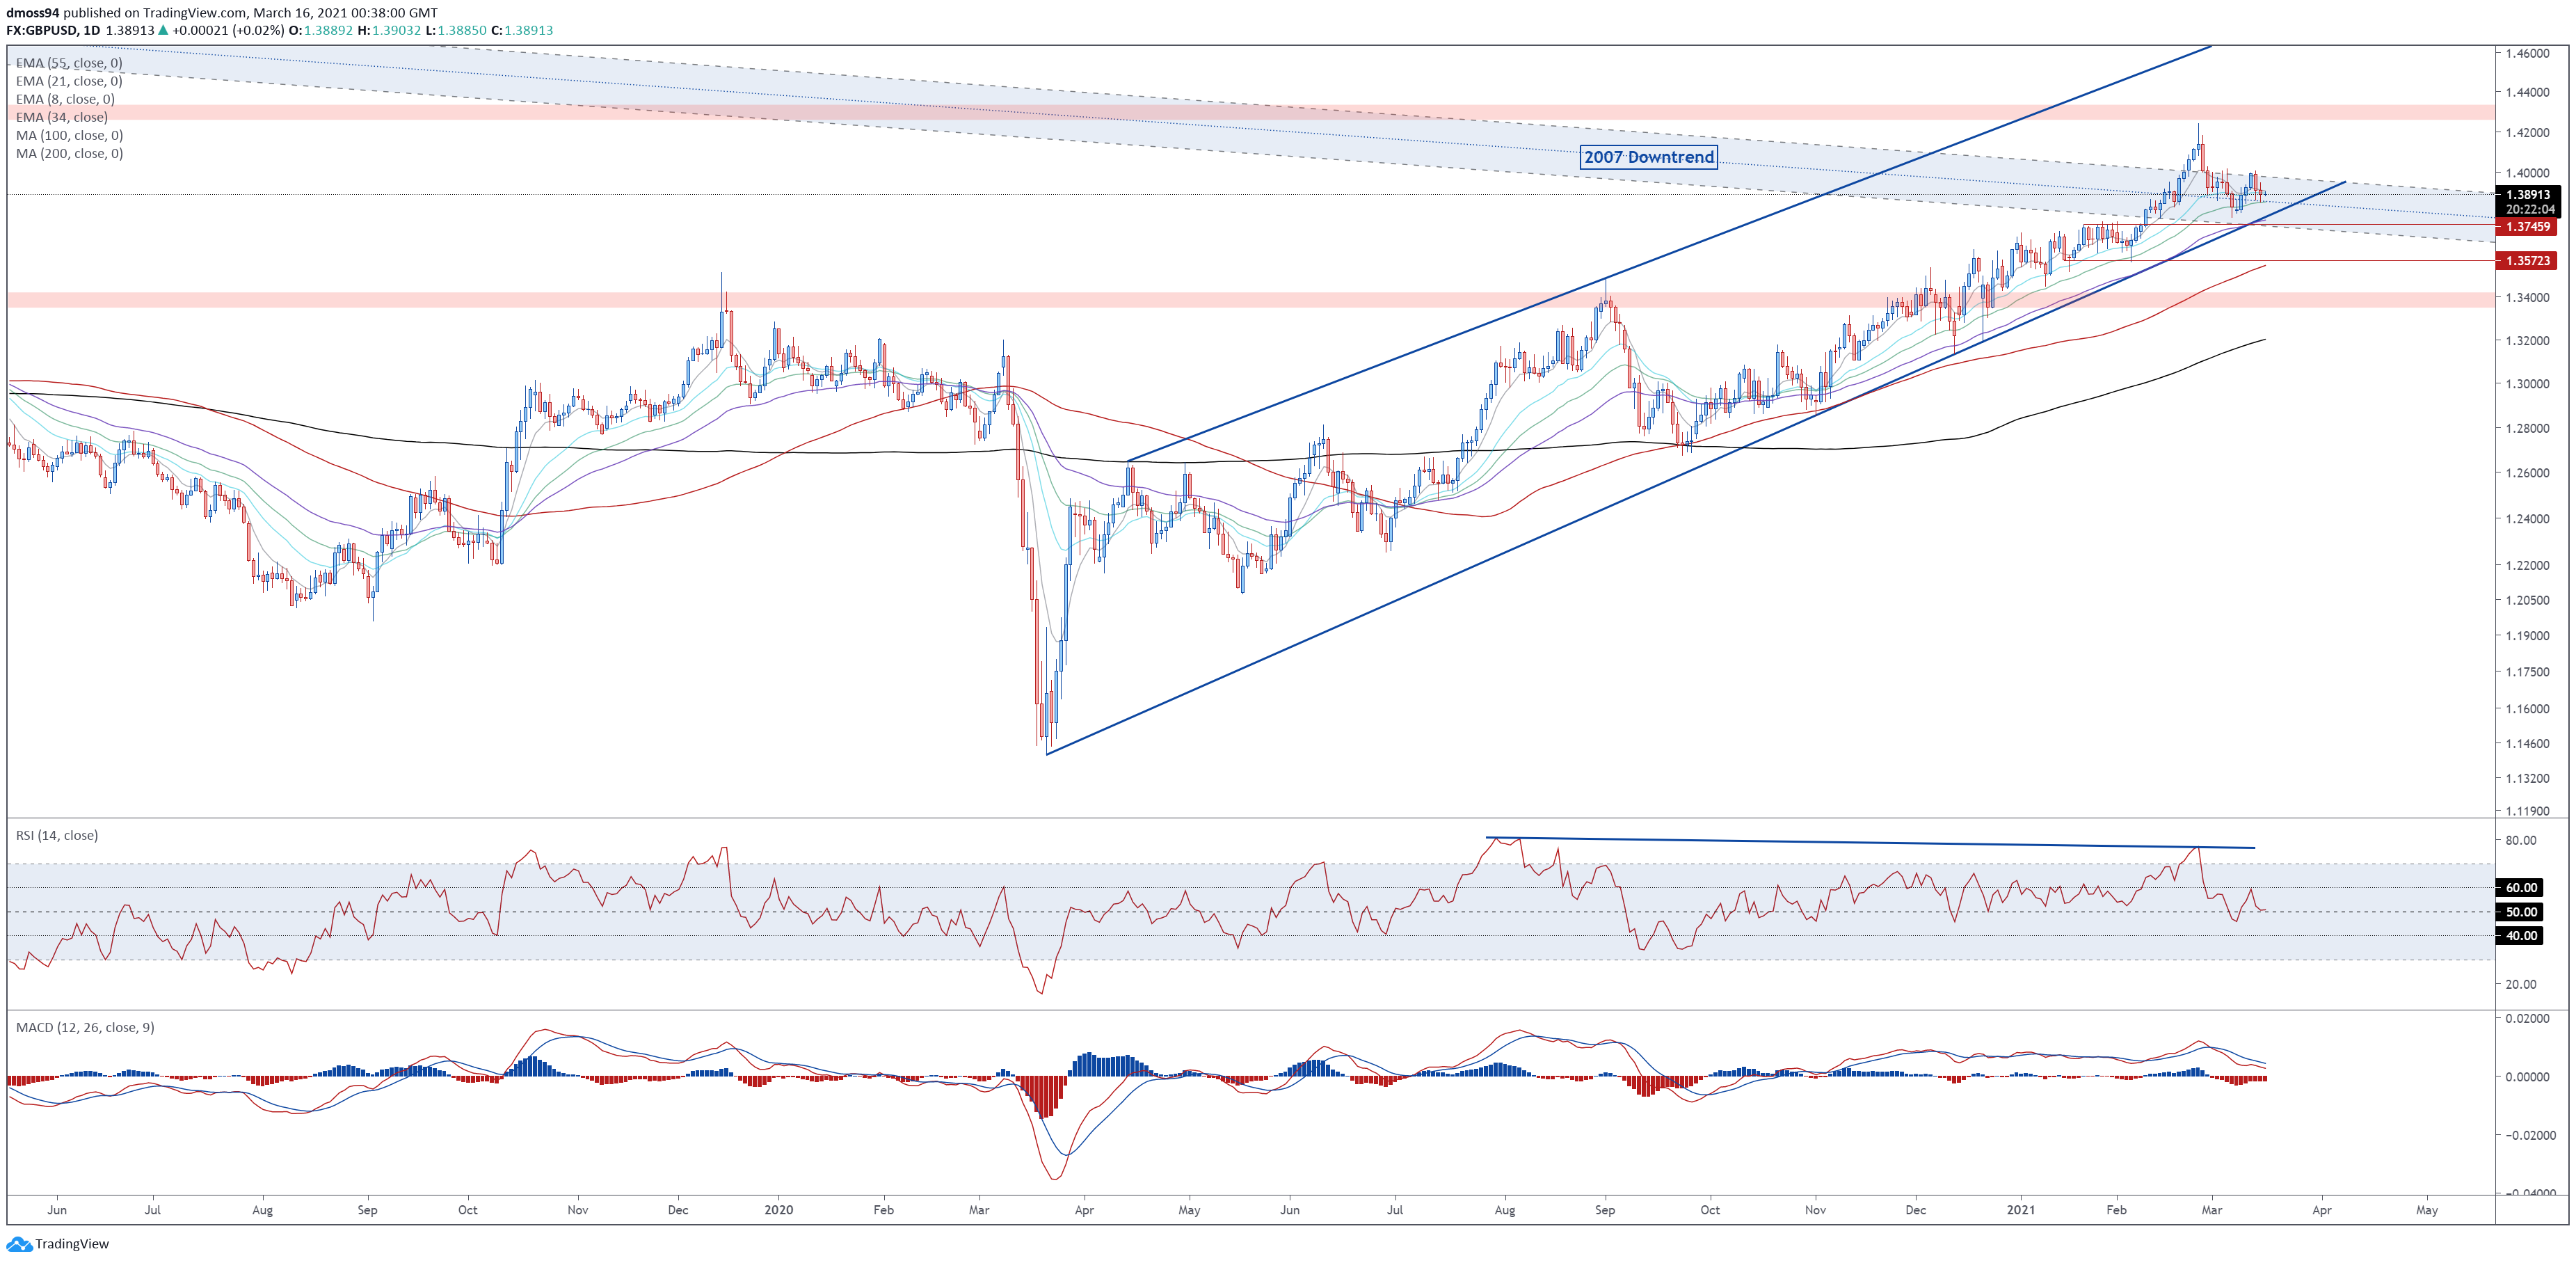
GBP/USD daily chart created using Tradingview
The British Pound has also dipped lower against the US Dollar during March, after the formation of a Shooting Star reversal candle on February 24 triggered a fresh wave of selling pressure and drove the exchange rate back towards psychological support at 1.3800.
Nevertheless, with the uptrend extending from the March 2020 nadir still intact, and both the MACD and RSI tracking above their respective neutral midpoints, an extended push lower seems relatively unlikely.
A daily close above 1.4000 is probably required to neutralize short-term selling pressure and carve a path for buyers to probe the yearly high (1.4241).
However, if the exchange rate dips back below 1.3850, a retest of the monthly low (1.3778) could be in the offing.
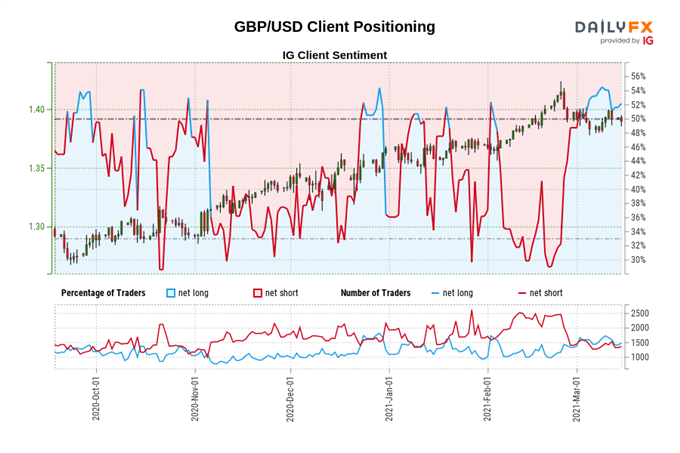
The IG Client Sentiment Report shows 54.29% of traders are net-long with the ratio of traders long to short at 1.19 to 1. The number of traders net-long is 18.36% higher than yesterday and 0.60% lower from last week, while the number of traders net-short is 6.14% higher than yesterday and 1.55% lower from last week.
We typically take a contrarian view to crowd sentiment, and the fact traders are net-long suggests GBP/USD prices may continue to fall.
Traders are further net-long than yesterday and last week, and the combination of current sentiment and recent changes gives us a stronger GBP/USD-bearish contrarian trading bias.
NZD/USD Daily Chart – 55-EMA Nurturing Uptrend
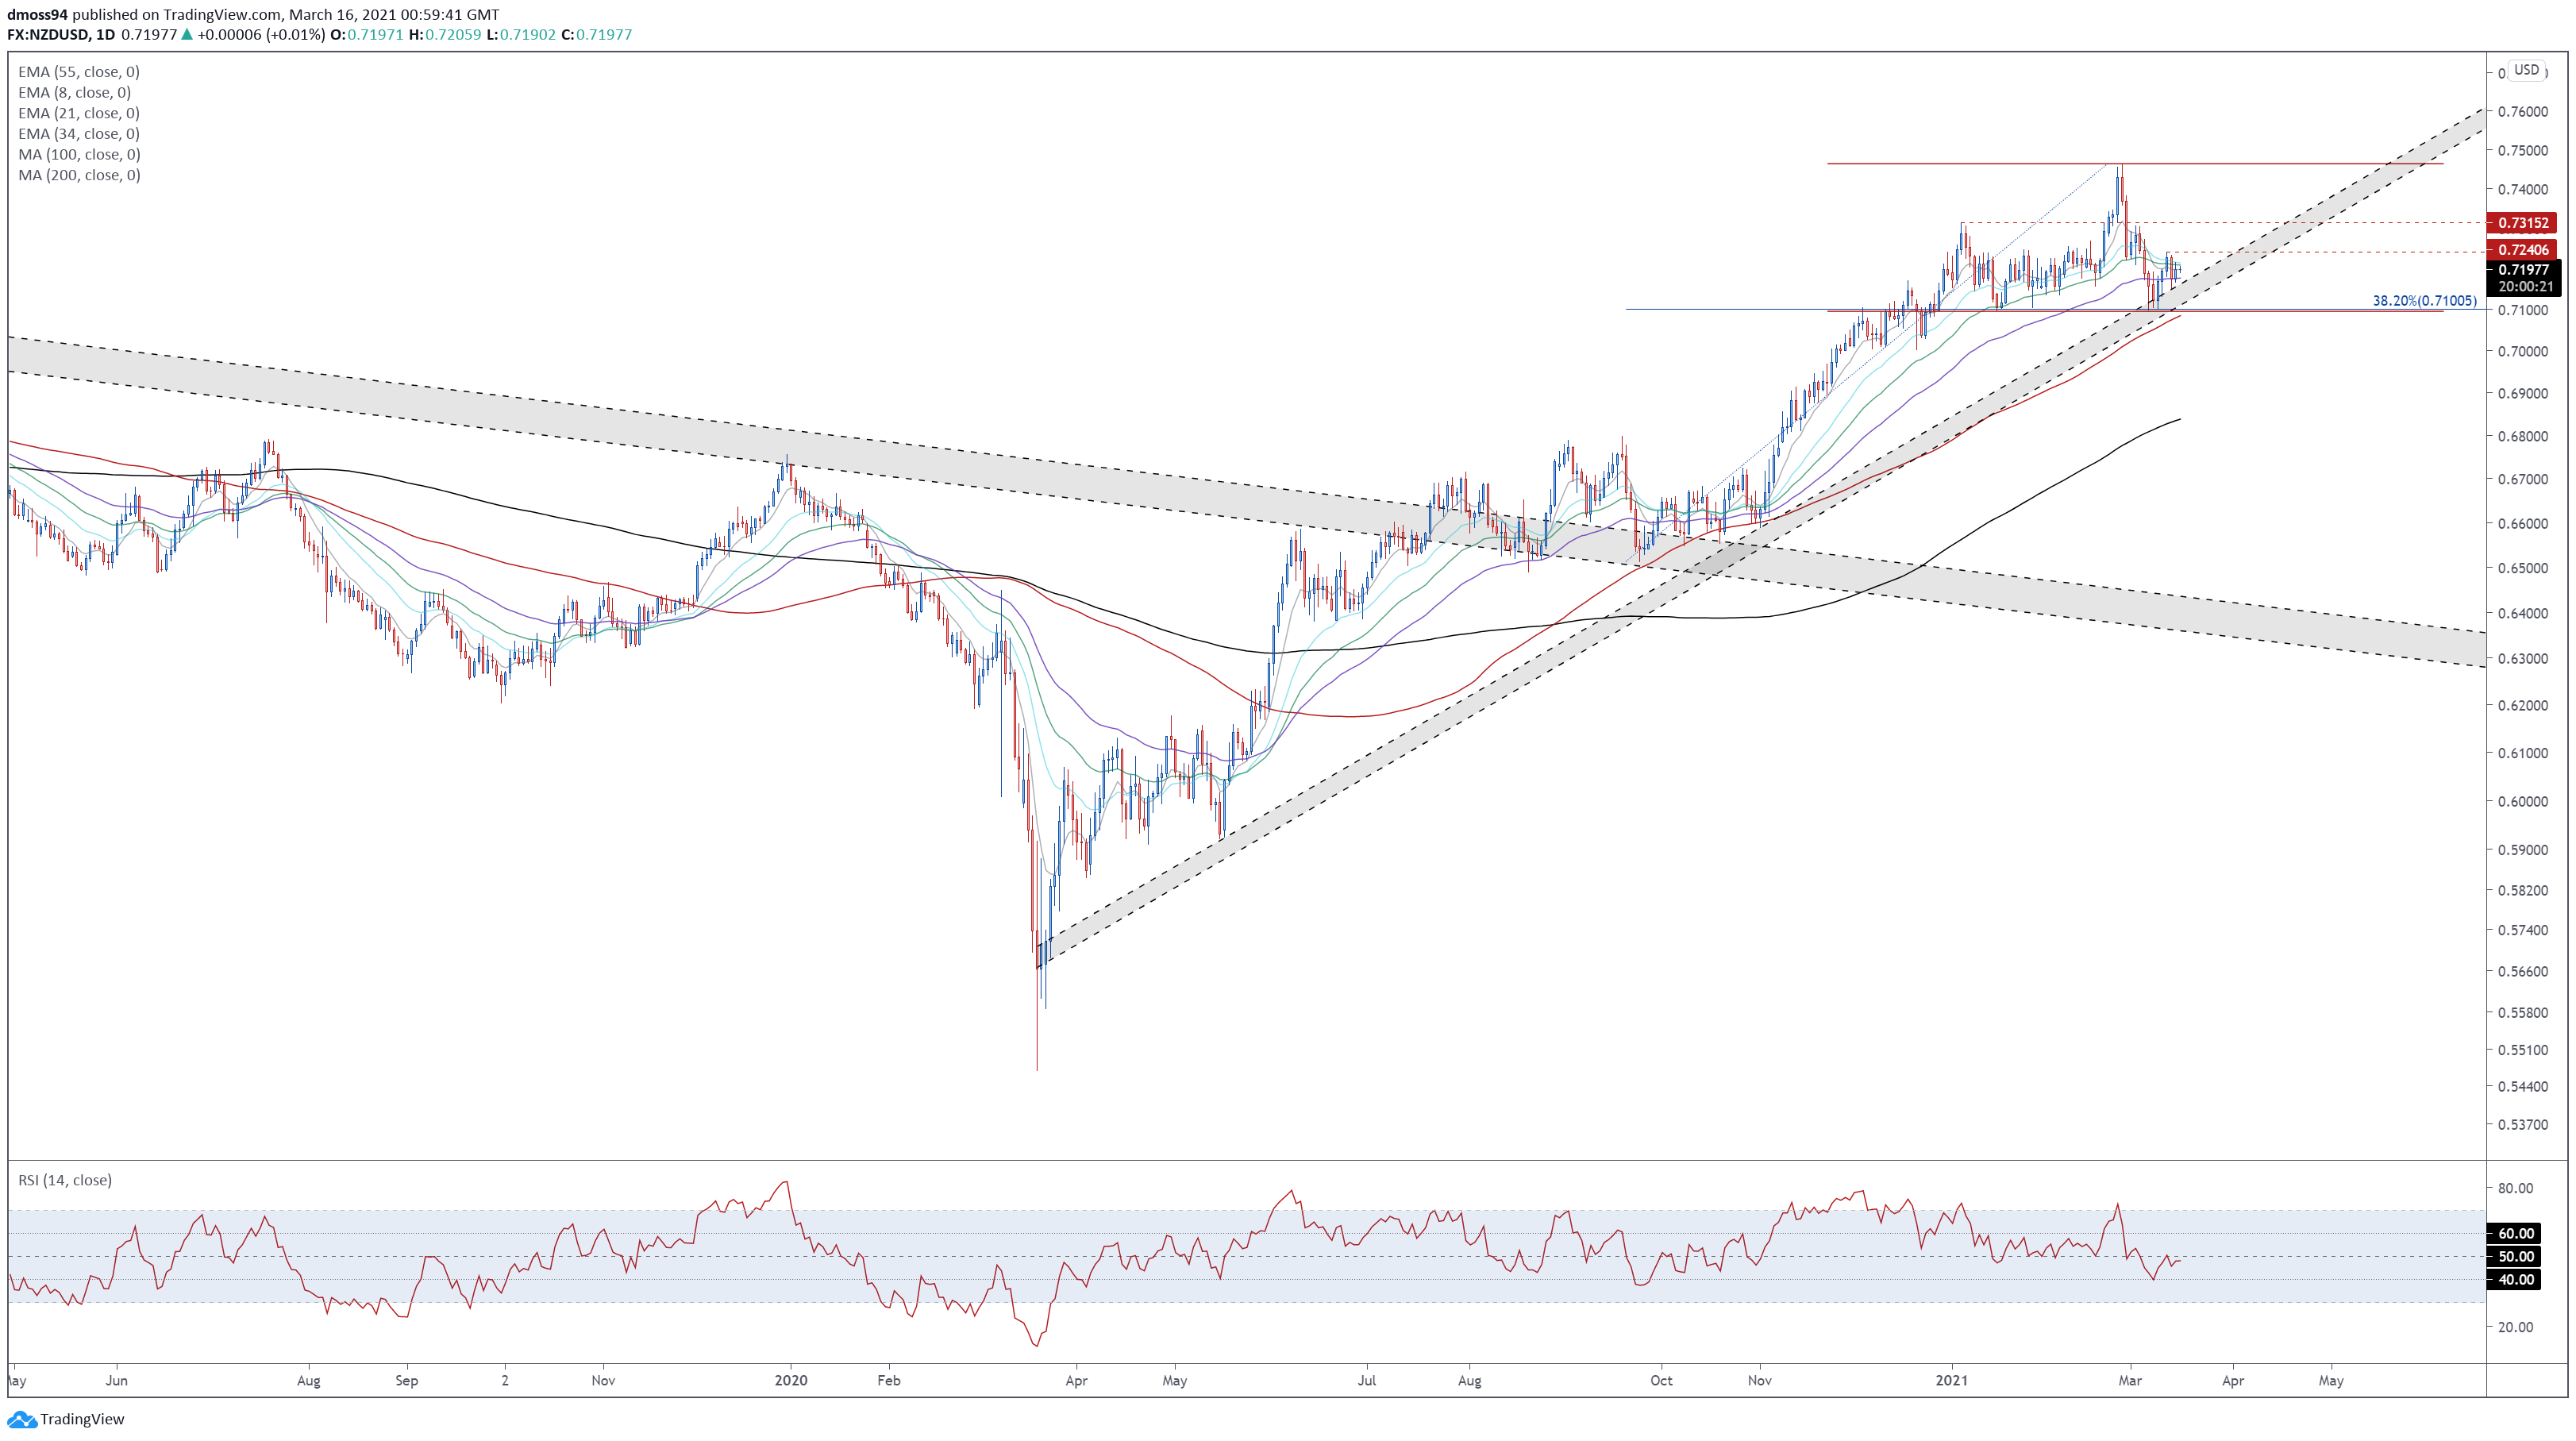
NZD/USD daily chart created using Tradingview
The technical outlook for NZD/USD continues to hint at further gains, as price scales the uptrend extending from the March 2020 lows and remains constructively perched above the trend-defining 55-EMA (0.7177).
A daily close back above 0.7240 would probably generate a push to retest intermediate resistance at 0.7315. Breaching that likely paves the way for the exchange rate to challenge the yearly high (0.7464).
Alternatively, diving back below the 55-EMA could result in price sliding back towards the monthly low (0.7103).
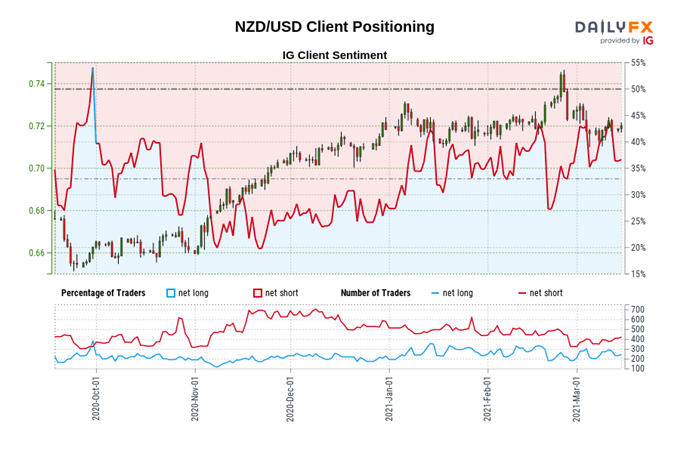
The IG Client Sentiment Report shows 37.64% of traders are net-long with the ratio of traders short to long at 1.66 to 1. The number of traders net-long is 18.10% higher than yesterday and 6.61% higher from last week, while the number of traders net-short is 11.82% higher than yesterday and 12.38% higher from last week.
We typically take a contrarian view to crowd sentiment, and the fact traders are net-short suggests NZD/USD prices may continue to rise.
Positioning is less net-short than yesterday but more net-short from last week. The combination of current sentiment and recent changes gives us a further mixed NZD/USD trading bias.
-- Written by Daniel Moss, Analyst for DailyFX
Follow me on Twitter @DanielGMoss


