


British Pound, GBP/USD, GBP/JPY, GBP/NZD, EUR/GBP – Talking Points:
- GBP/USD eyeing a test of the 1.3900 mark.
- GBP/JPY poised to extend climb as the RSI surges into overbought territory.
- EUR/GBP faced with further losses after breaching key support.
- GBP/NZD looking to retest the sentiment-defining 200-MA.
The neutral stance of the Bank of England, falling coronavirus cases and a rapid increase in the rate of local vaccinations may open the door for the British Pound to continue gaining ground against its major counterparts in the short term. Here are the key levels to watch for GBP/USD, GBP/JPY, EUR/GBP and GBP/NZD rates.
GBP/USD Daily Chart – Keying in on 1.3900 Mark

GBP/USD daily chart created using Tradingview
GBP/USD looks set to extend its recent push to fresh multi-year highs, as prices burst past psychological resistance at 1.3800.
However, bearish RSI divergence suggests that bullish momentum may be fading. Nevertheless, with price tracking above all six moving averages, and the MACD hovering firmly above its neutral midpoint, the path of least resistance seems higher.
A daily close above the February 10 high (1.3866) probably signals the resumption of the primary uptrend and carves a path for buyers to challenge the 61.8% Fibonacci (1.3956). Clearing that brings 1.4000 into the crosshairs.
Alternatively, sliding back below the 8-EMA (1.3797) could trigger a short-term pullback to its ‘slower’ 34-period counterpart (1.3663).
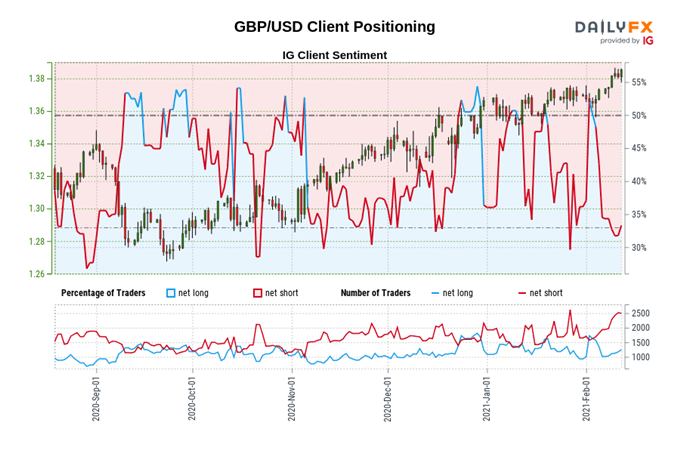
The IG Client Sentiment Report shows 31.28% of traders are net-long with the ratio of traders short to long at 2.20 to 1. The number of traders net-long is 11.83% lower than yesterday and 3.03% lower from last week, while the number of traders net-short is 5.79% lower than yesterday and 21.69% higher from last week.
We typically take a contrarian view to crowd sentiment, and the fact traders are net-short suggests GBP/USD prices may continue to rise.
Traders are further net-short than yesterday and last week, and the combination of current sentiment and recent changes gives us a stronger GBP/USD-bullish contrarian trading bias.
GBP/JPY Daily Chart – Overbought Readings Hint at Extension
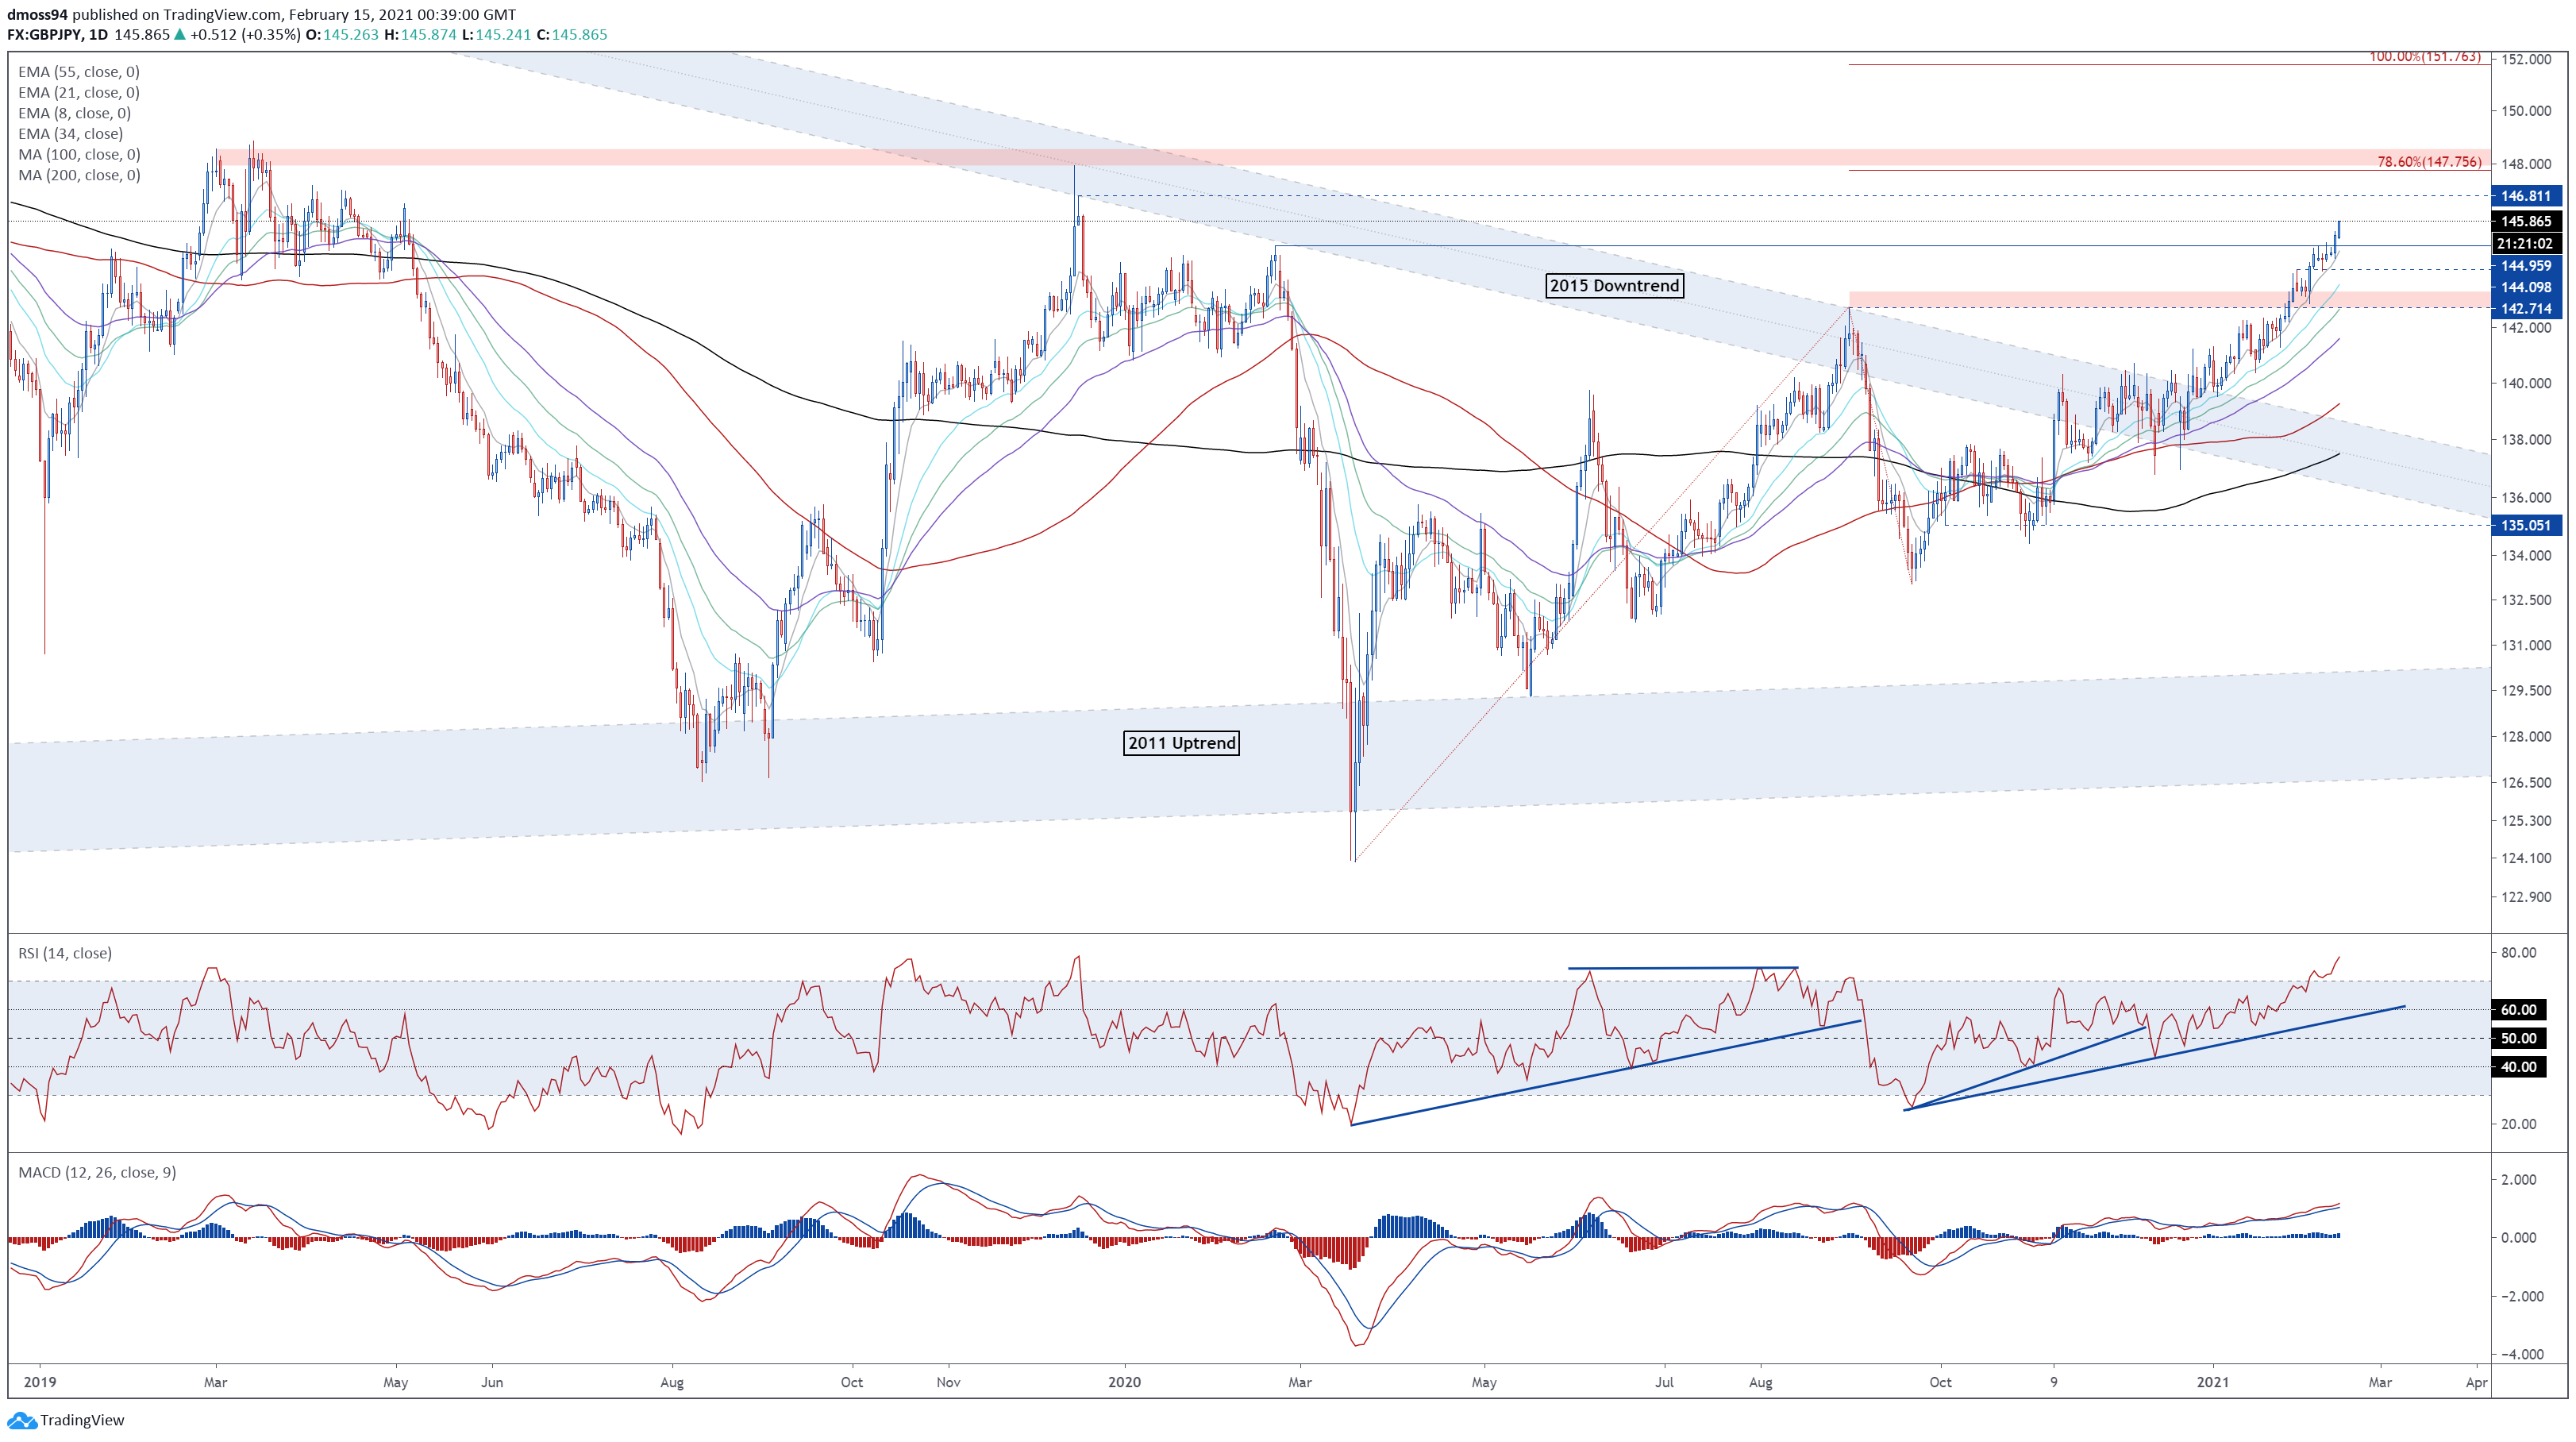
GBP/JPY daily chart created using Tradingview
The technical outlook for GBP/JPY rates also remains overtly bullish, as the RSI surges to its most extreme overbought readings since December 2019, and price hurdles key resistance at 2020 high (144.96).
A daily close above the psychologically imposing 146.00 mark is required to pave the way for the exchange rate to probe the December 2019 high (147.95).
However, if 146.00 remains intact, sellers may be able to drive price back towards former resistance-turned-support at the 2020 high (144.96). Piercing that likely generates a more extended pullback to the February 1 high (144.10).
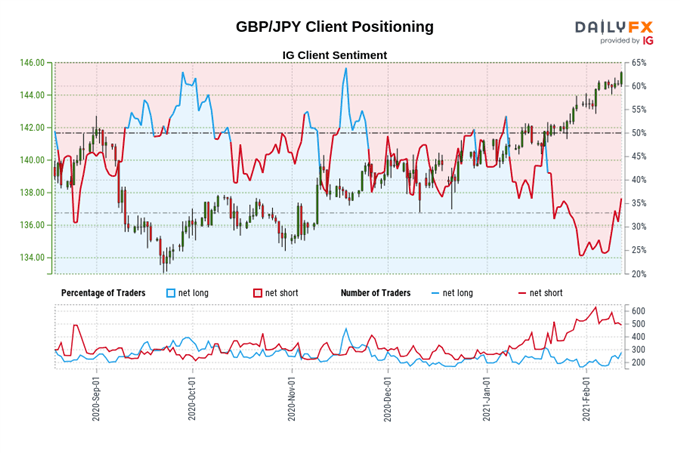
The IG Client Sentiment Report shows 29.67% of traders are net-long with the ratio of traders short to long at 2.37 to 1. The number of traders net-long is 24.64% lower than yesterday and 14.29% higher from last week, while the number of traders net-short is 0.80% lower than yesterday and 10.69% lower from last week.
We typically take a contrarian view to crowd sentiment, and the fact traders are net-short suggests GBP/JPY prices may continue to rise.
Positioning is more net-short than yesterday but less net-short from last week. The combination of current sentiment and recent changes gives us a further mixed GBP/JPY trading bias.
EUR/GBP Daily Chart – 8-EMA Guiding Price Lower

EUR/GBP daily chart created using Tradingview
EUR/GBP seems poised to continue sliding to fresh yearly lows, as price accelerates away from the 8-EMA.
With the RSI eyeing a push into oversold territory, and the slopes of all three EMAs markedly steepening to the downside, further losses look likely in the near term.
A daily close below the February 5 low (0.8738) likely signals the resumption of the primary downtrend and brings range support at 0.8670 – 0.8690 into play.
Conversely, if 0.8730 successfully neutralizes selling pressure, a rebound back towards 0.8800 could be on the cards.
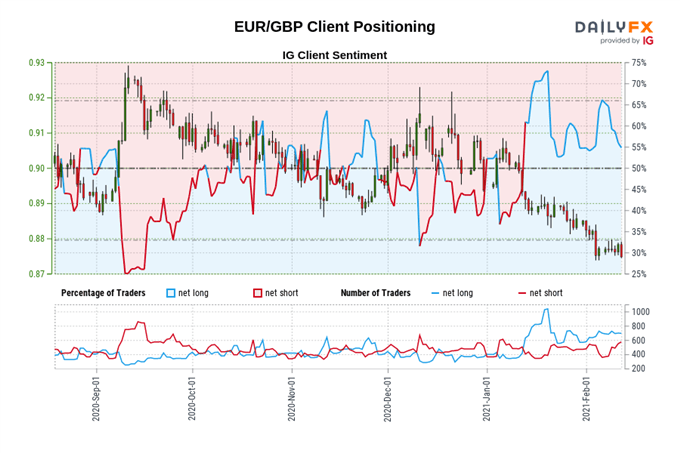
The IG Client Sentiment Report shows 61.08% of traders are net-long with the ratio of traders long to short at 1.57 to 1. The number of traders net-long is 2.66% higher than yesterday and 0.54% lower from last week, while the number of traders net-short is 14.00% lower than yesterday and 24.87% higher from last week.
We typically take a contrarian view to crowd sentiment, and the fact traders are net-long suggests EUR/GBP prices may continue to fall.
Positioning is more net-long than yesterday but less net-long from last week. The combination of current sentiment and recent changes gives us a further mixed EUR/GBP trading bias.
GBP/NZD Daily Chart – 200-MA in the Crosshairs
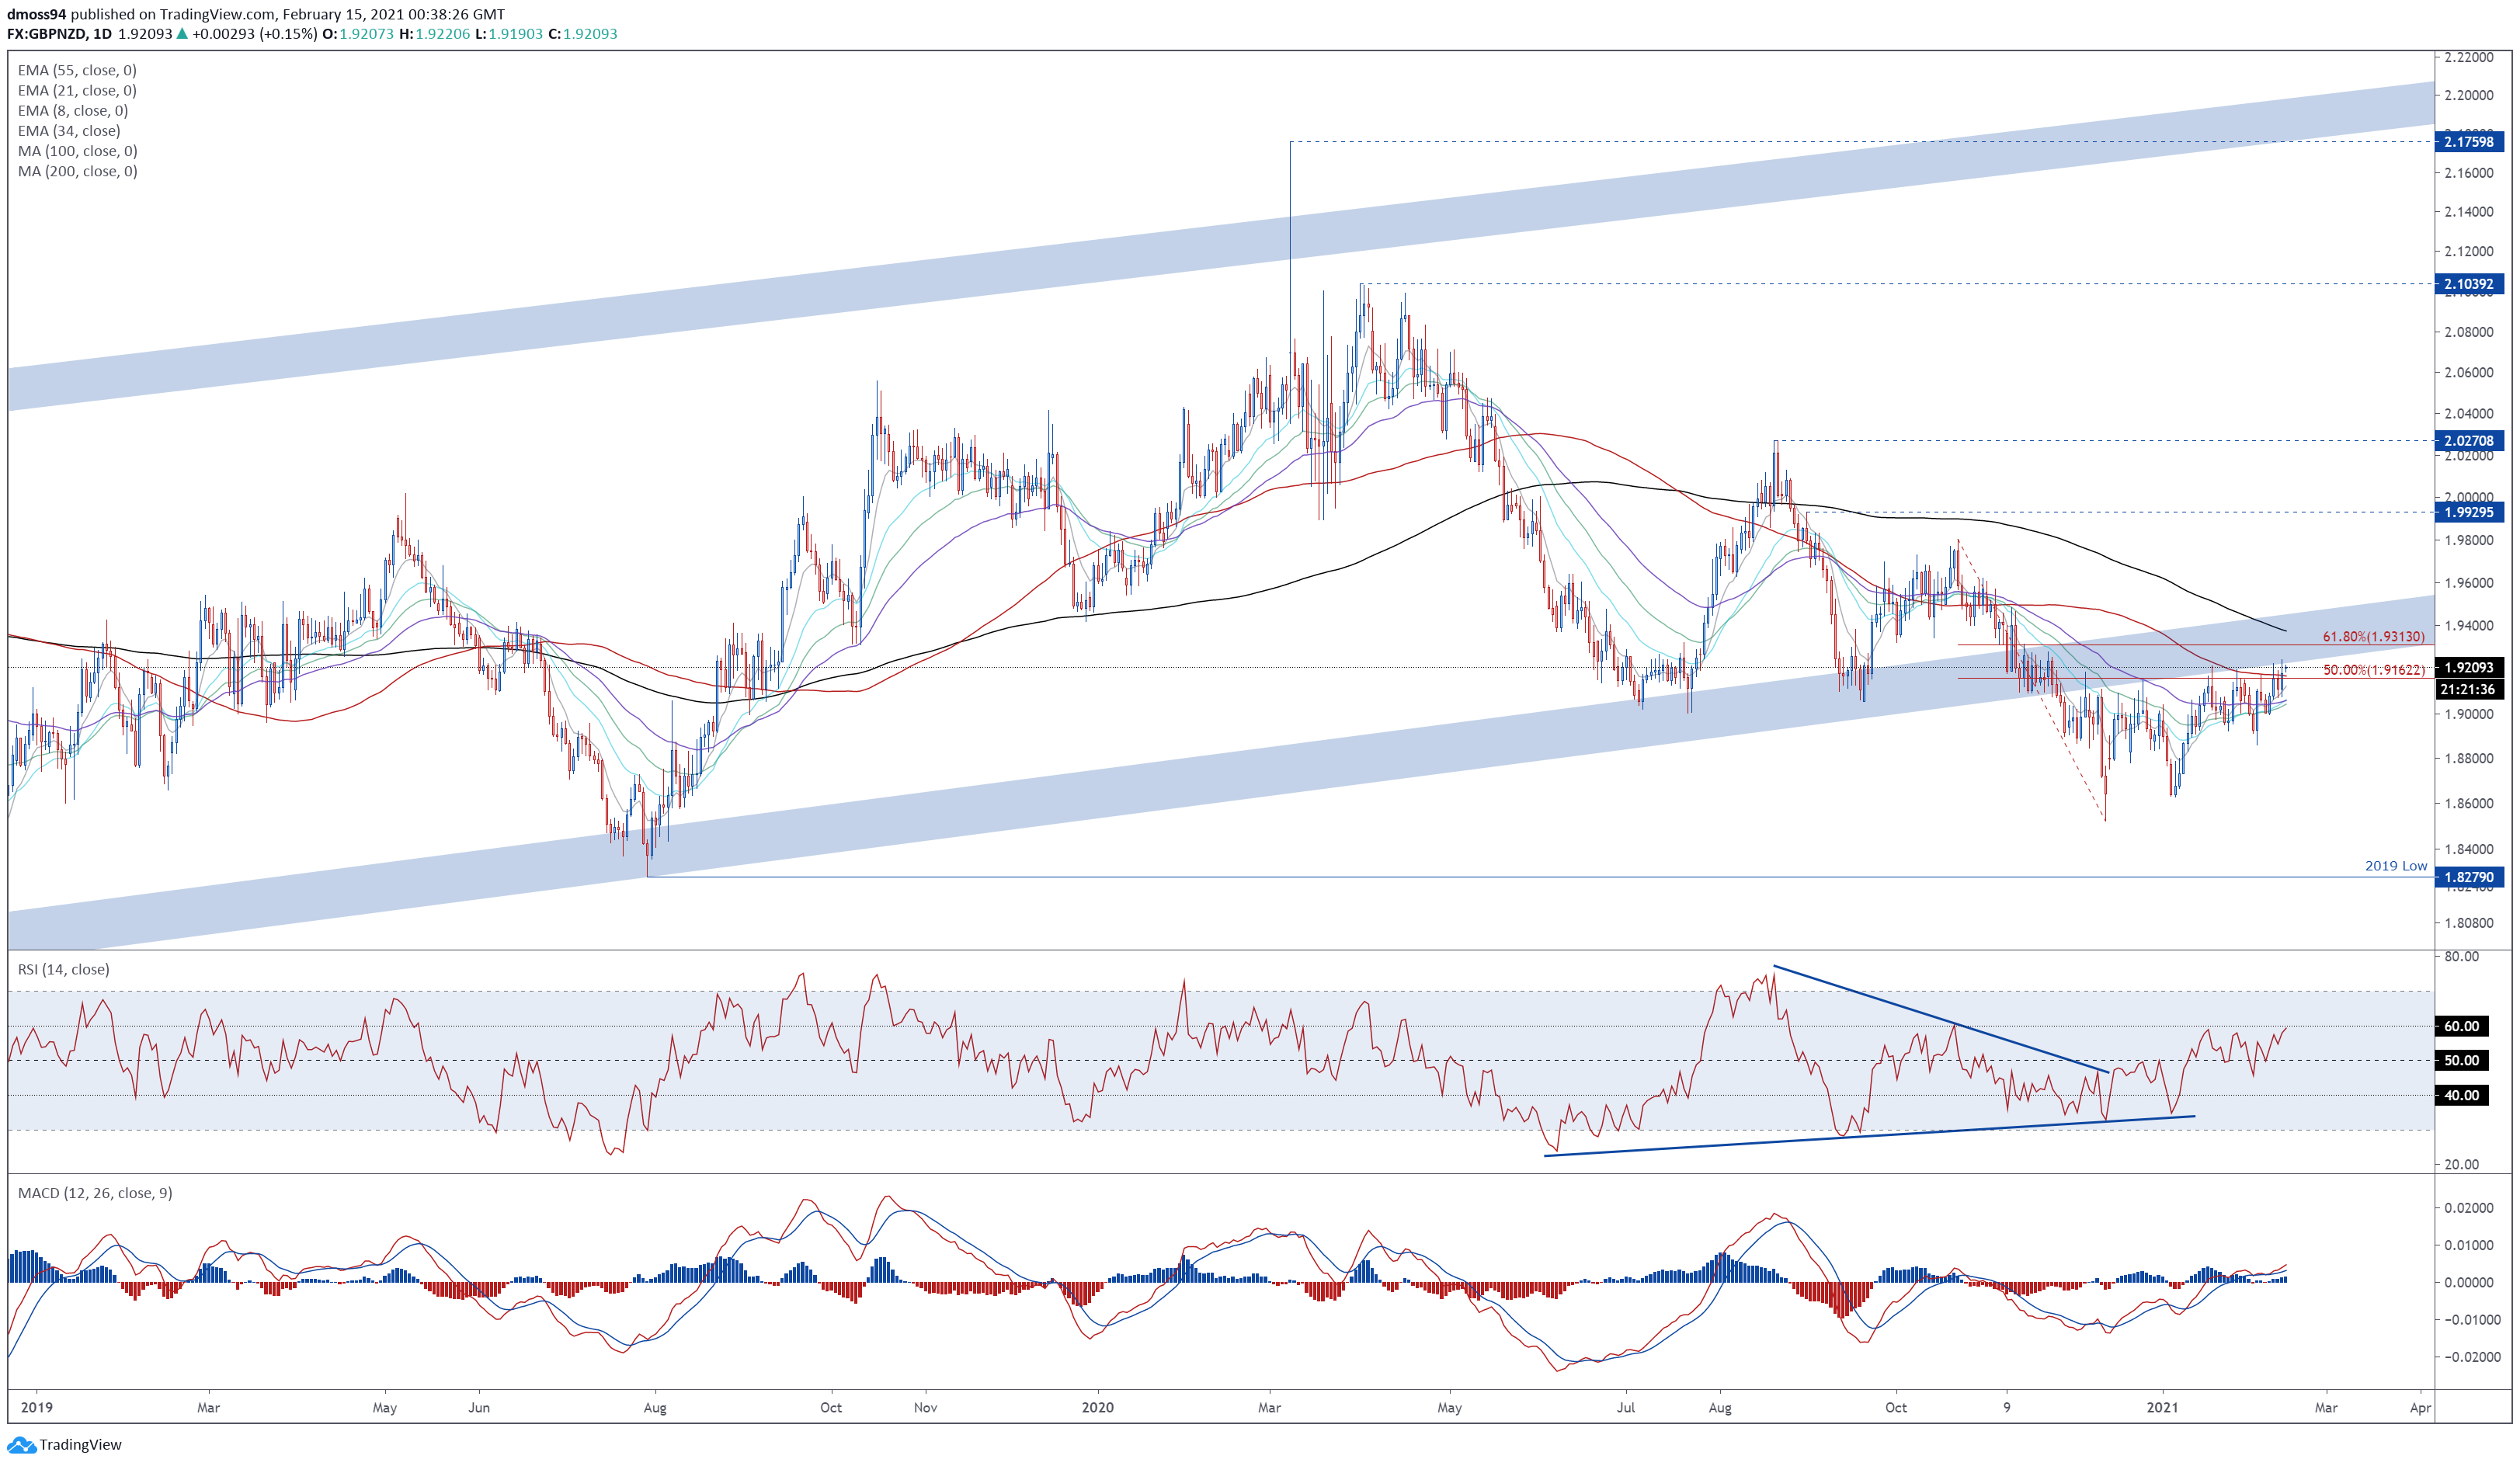
GBP/NZD daily chart created using Tradingview
The GBP/NZD exchange rate’s rebound from the January low seems set to endure in the near term, after price gapped back above the 100-MA and psychological resistance at 1.9200.
The development of the RSI and MACD are indicative of swelling bullish momentum, as both oscillators track firmly above their respective neutral midpoints.
If price remains constructively positioned above 1.9150, a push to challenge the sentiment-defining 200-day moving average (1.9378) looks on the cards.
On the other hand, a daily close below 1.9150 probably intensifies near-term selling pressure and carves a path to retest the monthly low (1.8861)
-- Written by Daniel Moss, Analyst for DailyFX
Follow me on Twitter @DanielGMoss


