


Sterling Technical Price Outlook: GBP/USD Weekly Trade Levels
- Sterling technical trade level update – Weekly Chart
- GBP/USD Breakout underway / threat for deeper correction into January
- Constructive while above yearly open at 1.3646– critical resistance steady into 1.3955
The British Pound is poised to mark a fifth consecutive weekly advance with GBP/USD rallying more than 3% off the January lows. A breakout above key technical resistance suggests further upside in the days ahead as Sterling rallies to multi-year highs. These are the updated targets and invalidation levels that matter on the GBP/USD weekly technical chart. Review my latest Strategy Webinar for an in-depth breakdown of this Cable trade setup and more.
Sterling Price Chart - GBP/USD Weekly
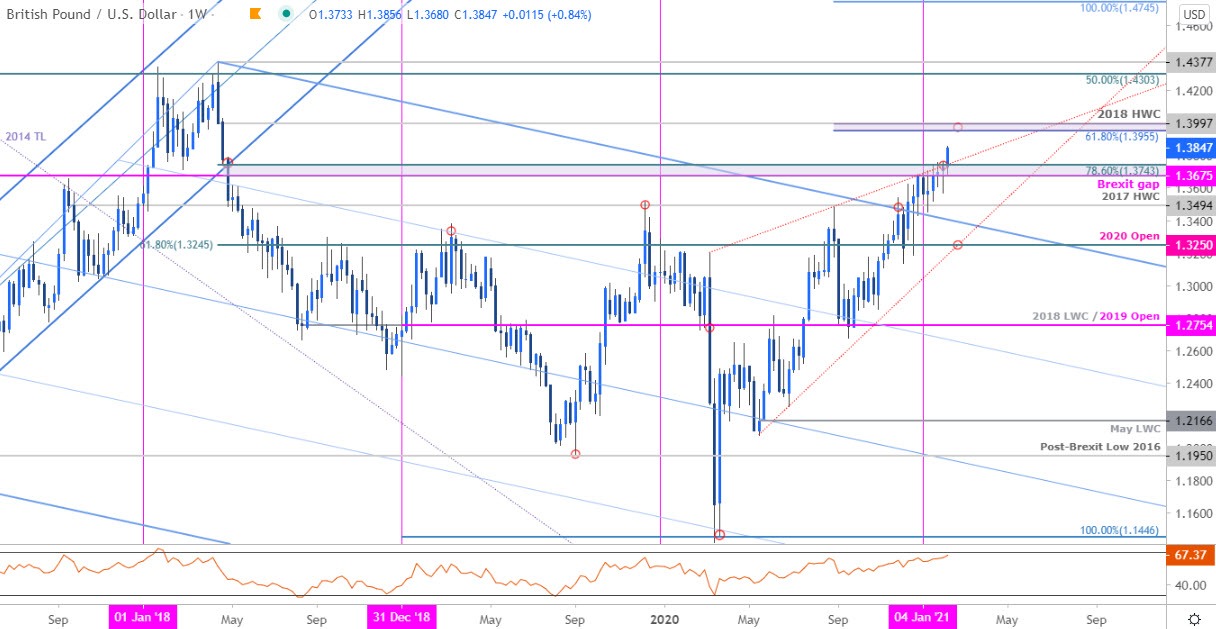
Chart Prepared by Michael Boutros, Technical Strategist; GBP/USD on Tradingview
Notes: In my last Sterling Weekly Price Outlook we noted that GBP/USD had, “stalled at confluence trend resistance into the start of the year…It’s important to note the technical significance of this resistance threshold – expect substantial acceleration in the event of a topside breach here.” Sterling held this resistance zone for more than six-weeks with a breakout yesterday fueling a rally of more than 0.8% this week.
The breakout keeps the focus higher in price with initial resistance objectives eyed 1.3955/97 – a region defined by the 61.8% Fibonacci extension of the March advance and the 2018 high-week reversal close. Look for a larger reaction there IF reached for guidance with a breach exposing the 1.43-handle. Initial support now at 1.3743 backed closely by the 1.3675. Ultimately, a break / close below the objective yearly open at 1.3646 is needed to shift the focus lower again in Sterling.
For a complete breakdown of Michael’s trading strategy, review his Foundations of Technical Analysis series on Building a Trading Strategy
Bottom Line: A Sterling breakout is underway after breaching above critical confluence resistance and keeps the GBP/USD outlook weighted to the topside near-term. From a trading standpoint, look for downside exhaustion ahead of 1.3675 on pullbacks IF price is indeed heading higher with initial resistance objectives eyed above the 1.39-handle. I’ll publish an updated Sterling Price Outlook once we get further clarity on the near-term GBP/USD technical trade levels.

Sterling Trader Sentiment - GBP/USD Price Chart
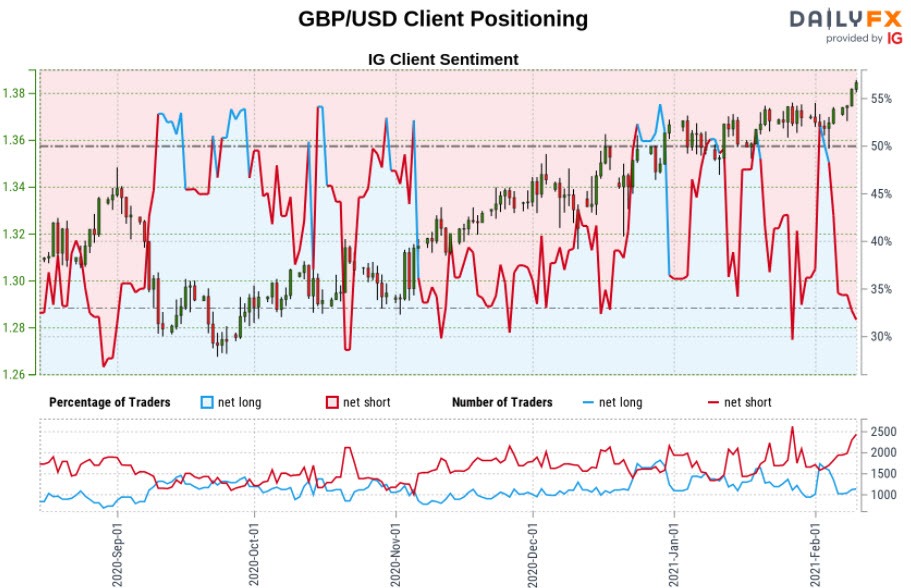
- A summary of IG Client Sentiment shows traders are net-short GBP/USD - the ratio stands at –1.92 (34.19% of traders are long) – typically bullish reading
- Long positions are6.99% higher than yesterday and 17.68% lower from last week
- Short positions are4.74% higher than yesterday and 32.96% higher from last week
- We typically take a contrarian view to crowd sentiment, and the fact traders are net-short suggests GBP/USD prices may continue to rise. Traders are less net-short than yesterday but more net-short from last week. The combination of current positioning and recent changes gives us a further mixed GBP/USD trading bias from a sentiment standpoint.
| Change in | Longs | Shorts | OI |
| Daily | -13% | 8% | -5% |
| Weekly | -17% | 23% | -2% |
---
Key UK / US Economic Data Releases
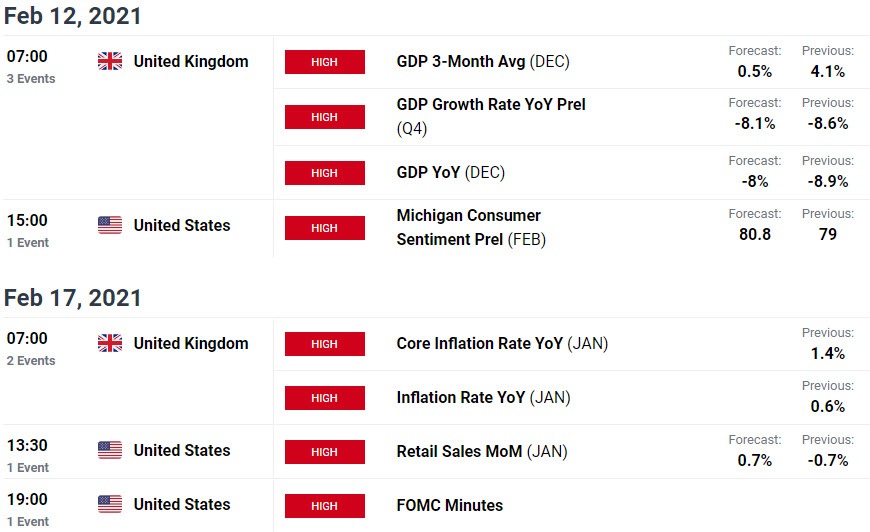
Economic Calendar - latest economic developments and upcoming event risk.
Previous Weekly Technical Charts
- Euro (EUR/USD)
- US Dollar (DXY)
- Japanese Yen (USD/JPY)
- Crude Oil (WTI)
- Gold (XAU/USD)
- Australian Dollar (AUD/USD)
- Canadian Dollar (USD/CAD)

--- Written by Michael Boutros, Technical Currency Strategist with DailyFX
Follow Michael on Twitter @MBForex


