


Sterling Technical Price Outlook: GBP/USD Trade Levels
- Sterling technical trade level update – Daily & Intraday Charts
- GBP/USD rally fails at technical uptrend resistance – rally vulnerable sub-1.3250
- Initial support 1.3092 – weakness beyond would risk larger correction in British Pound
Sterling is down more than 1.3% off the weekly / monthly high against the US Dollar with GBP/USD responding to confluent technical resistance. While the broader outlook for the British Pound remains constructive, the immediate advance remains vulnerable below this key threshold and we’re looking for a reaction in the days ahead for guidance. These are the updated targets and invalidation levels that matter on the GBP/USD price charts. Review my latest Weekly Strategy Webinar for an in-depth breakdown of this Cable trade setup and more.
Sterling Price Chart – GBP/USD Daily

Chart Prepared by Michael Boutros, Technical Strategist; GBP/USD on Tradingview
Technical Outlook: Sterling rallied more than 2.8% into the open of November trade with GBP/USD failing at confluence resistance at 1.3245-1.3311- a region defined by the 61.8% Fibonacci retracement of the 2018 decline, the objective 2020 yearly open and the 100% extension of the March advance. The subsequent reversal is now approaching near-term uptrend support and we’re looking for a reaction for guidance.
Initial daily support rests along the median-line of the ascending pitchfork formation extending off the September lows with key support / broader bullish invalidation now raised to the 61.8% retracement / lower parallel at ~1.2919. A topside breach of this formation would likely fuel an accelerated Sterling rally with such a scenario exposing the yearly high-day close at 1.3386.
Sterling Price Chart – GBP/USD 120min

Notes: A closer look at Sterling price action shows GBP/USD trading within an embedded ascending channel formation with the reversal off confluence uptrend resistance now approaching the weekly opening-range lows. Initial support rests at 1.3092 – a break / close below this threshold would be needed to suggest a larger correction is underway towards 1.3028 and the lower parallels.

Bottom line: Sterling turned from confluence uptrend resistance and leaves the rally vulnerable near-term while below the 2020 yearly open. From at trading standpoint, look for a break of the weekly opening-range for guidance with the threat lower while below 1.3250. Ultimately a larger correction may offer more favorable opportunities closer to uptrend support with a breach above 1.3311 needed to keep the focus on 1.3386. Review my latest British Pound Weekly Price Outlook for a closer look at the longer-term GBP/USD technical trade levels.
For a complete breakdown of Michael’s trading strategy, review his Foundations of Technical Analysis series on Building a Trading Strategy
Sterling Trader Sentiment – GBP/USD Price Chart
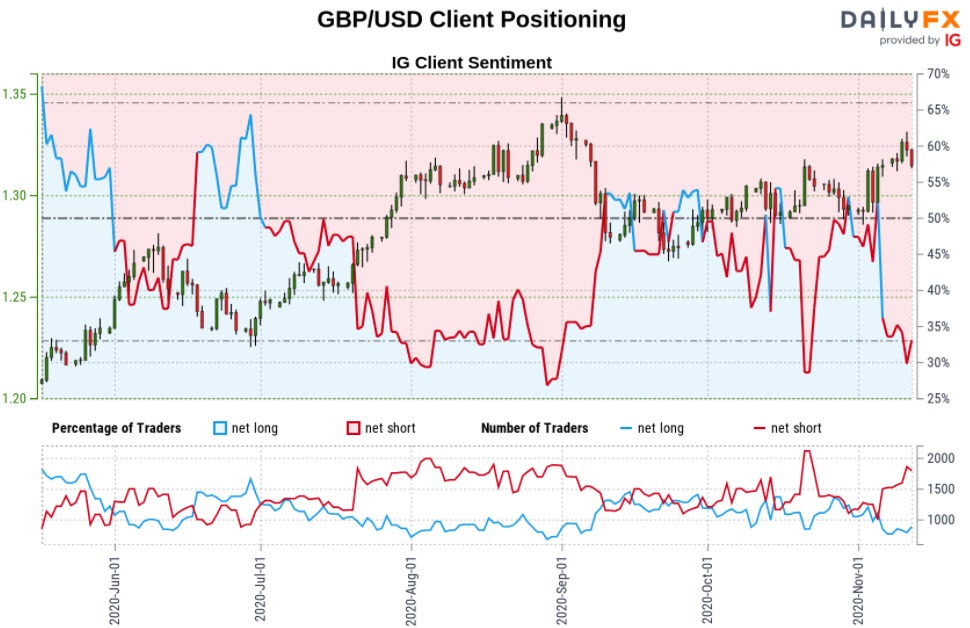
- A summary of IG Client Sentiment shows traders are net-short GBP/USD - the ratio stands at -2.02 (33.08% of traders are long) – bullish reading
- Long positions are5.39% higher than yesterday and 15.11% lower from last week
- Short positions are3.35% lower than yesterday and 37.59% higher from last week
- We typically take a contrarian view to crowd sentiment, and the fact traders are net-short suggests GBP/USD prices may continue to rise. Yet, traders are less net-short than yesterday but more net-short from last week and the combination of current positioning and recent changes gives us a further mixed GBP/USD trading bias from a sentiment standpoint.
| Change in | Longs | Shorts | OI |
| Daily | -2% | -8% | -4% |
| Weekly | -2% | 2% | -1% |
---
Key UK / US Data Releases

Economic Calendar - latest economic developments and upcoming event risk.
Active Technical Setups
- Euro Outlook: EUR/USD Breakout Fails Resistance- Election Rally Over?
- Mexican Peso Outlook: USD/MXN Election Reversal to Multi-Month Low
- Gold Price Outlook: The Post-Election Battle for 1900– XAU/USD Levels
- Canadian Dollar Outlook: USD/CAD Spills into Support- Election Levels
- Australian Dollar Forecast: AUD/USD Grinds into Downtrend Resistance
- Written by Michael Boutros, Currency Strategist with DailyFX
Follow Michael on Twitter @MBForex


