


GBP/USD Price Technical Outlook
- GBP/USD in free fall
- Will the price rebound at these thresholds?
GBP/USD Price – Bearish Market
On Friday, British Pound fell to its lowest level in five months at 1.2262. Then closed the weekly candlestick in the red with nearly 6% loss. This week, the market resumed bearish price action and tested latest Brexit’s lows.
Alongside that, the Relative Strength Index (RSI) dipped below 30 then remained in oversold territory, highlighting a powerful downside momentum.
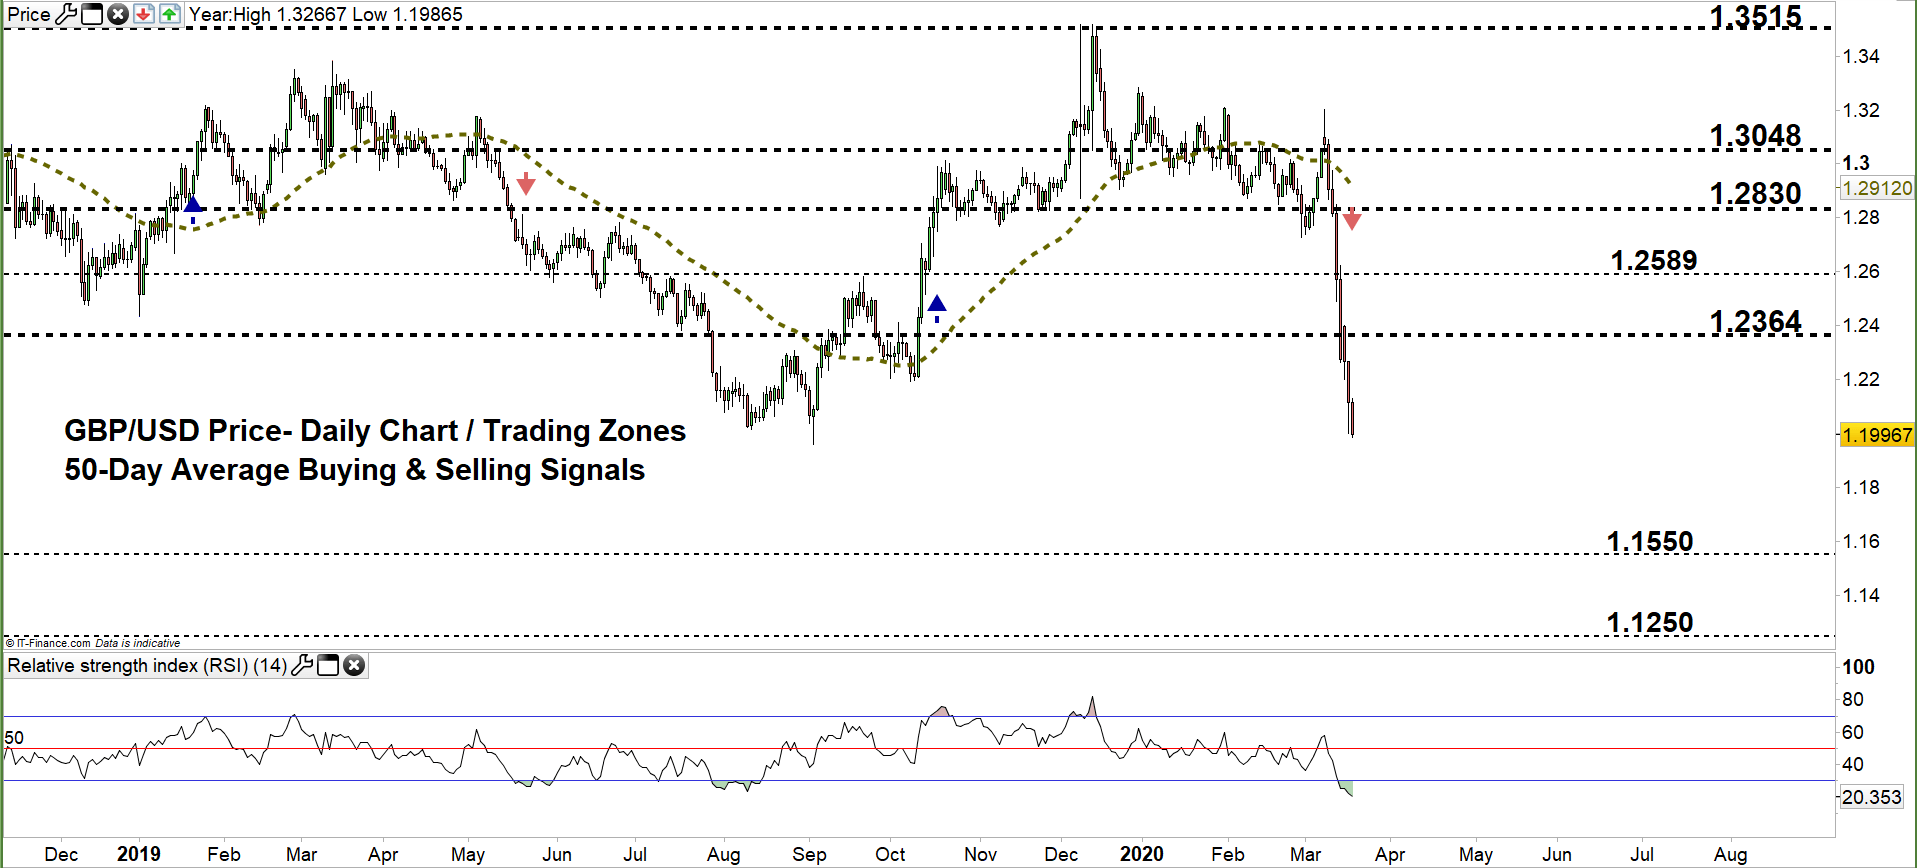
GBP/USD DAILY PRICE CHART (Nov 14, 2018 – MaR 18, 2020) Zoomed out

GBP/USD DAILY PRICE CHART (Oct 16– Mar 18, 2020) Zoomed IN
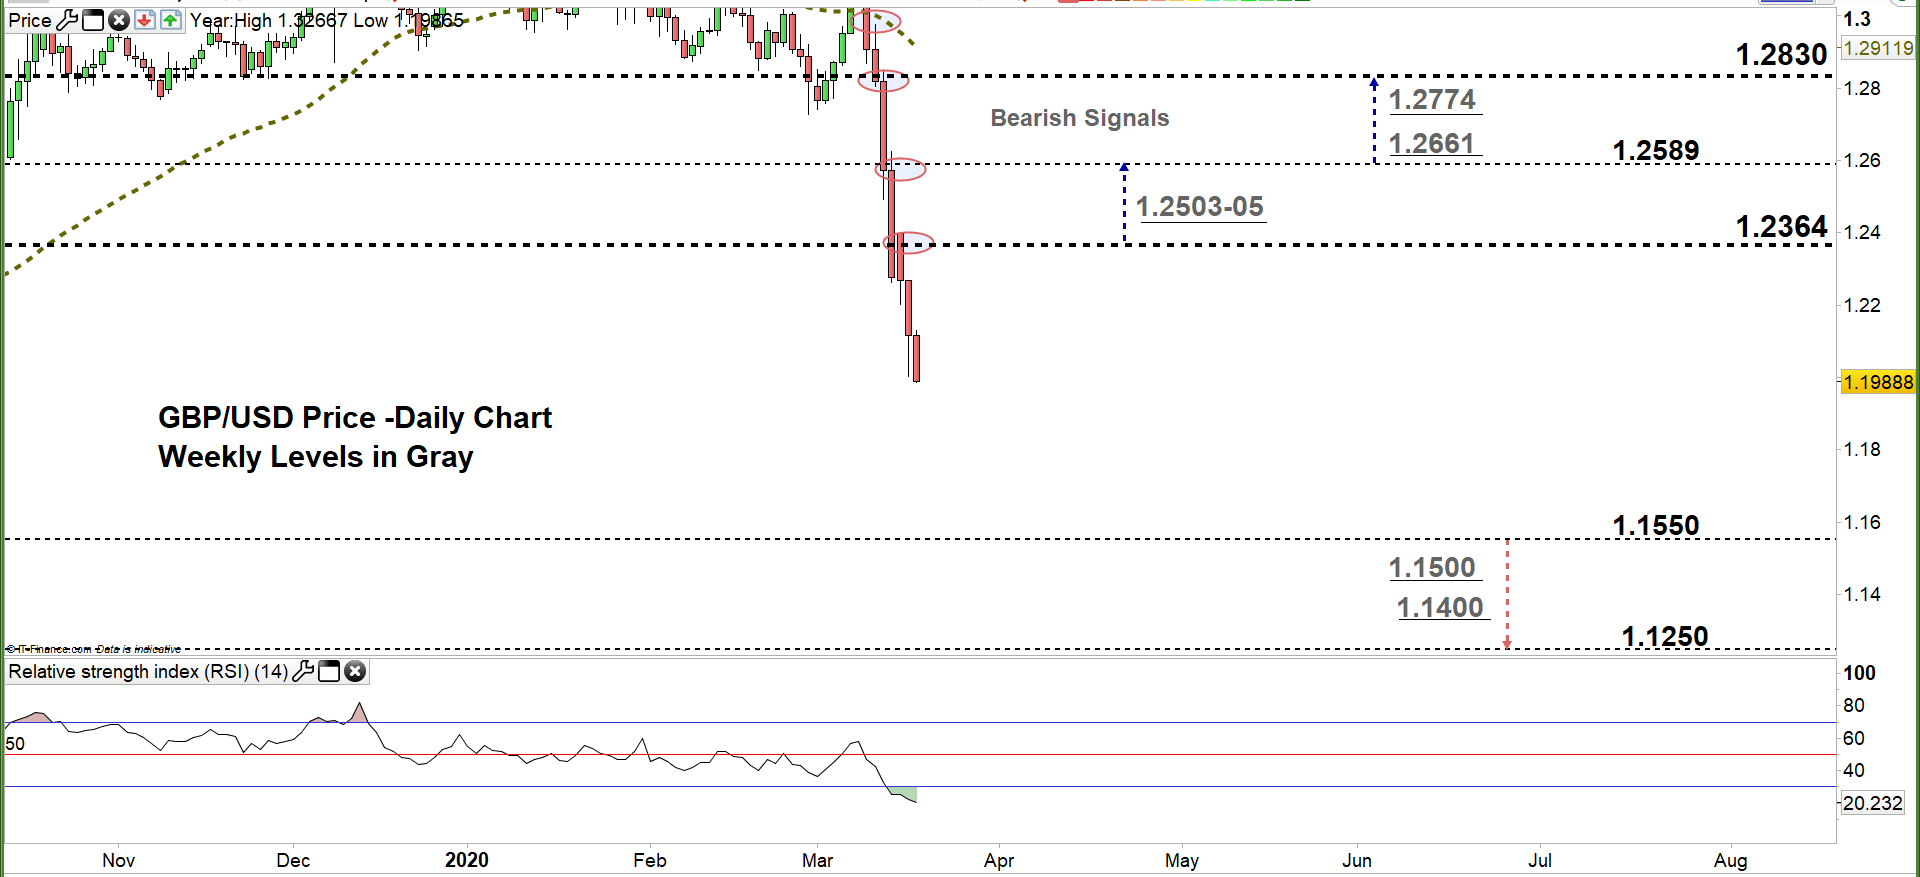
From the daily chart, we noticed that on March 10 GBP/USD declined then closed below the 50-day average generating a bearish signal. Later on, the price slid from a trading zone to a lower, emphasizing the bearish outlook of the market then settled in current trading zone 1.1550 – 1.2364.
This week, GBPUSD pointed lower eyeing a test of the low end of the zone. Further close below this level could send Cable to 1.1250. Yet, the psychological support levels underlined on the chart (zoomed in) should be considered.
That said, any failure in closing below the low end of the zone reflects bears hesitation and could lead bears to exit the market, allowing GBPUSD to rally towards the high end of the zone. Further close above this level may cause a further rally towards 1.2589. In that scenario, the daily resistance area marked on the chart should be kept in focus.

GBP/USD Four Hour PRICE CHART (Mar 7 – Mar 18, 2020)
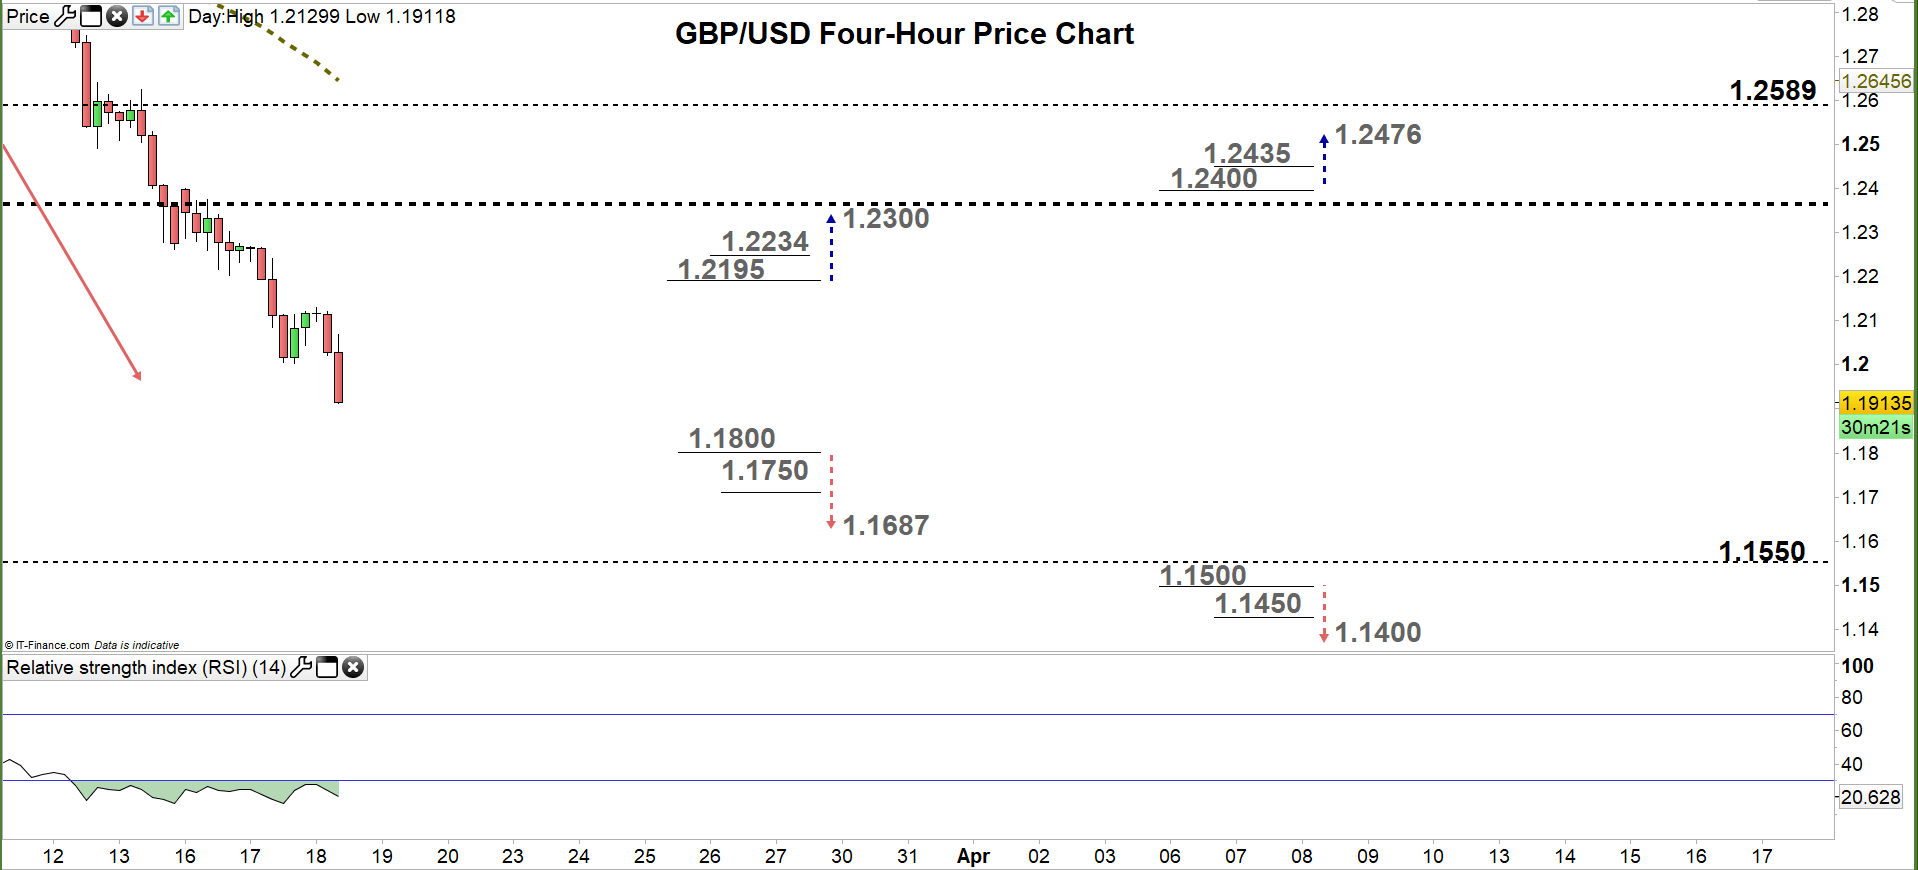
Looking at the four-hour chart, we noticed that last week GBP/USD started a downtrend move creating lower highs with lower lows. Today, Cable has broken below the yearly support at 1.1987 and printed its lowest levels in over three years.
Thus, a break below 1.1800 handle could send GBPUSD even lower towards 1.1687. Yet, the psychological support level underscored on the chart should be watched closely. On the other hand, any break above 1.2195 might cause a rally towards 1.2300. Nevertheless, the daily resistance level printed on the chart should be monitored.
See the chart to find out more about key levels Cable would encounter in a further bearish /bullish scenario.

Written By: Mahmoud Alkudsi
Please feel free to contact me on Twitter: @Malkudsi


