


GBP/USD TECHNICAL ANALYSIS – TALKING POINTS:
- Pound slips past neckline support, hinting at deeper losses vs US Dollar
- Downturn follows rejection after testing 12-year bearish trend resistance
- Trader sentiment studies reinforce the case for a deeper GBP/USD drop
The British Pound is attempting to restart a 12-year downtrend against the US Dollar after putting in a dramatic Bearish Engulfing candlestick pattern at resistance defining the bounds of the descent, as expected. Prices have followed up a break of an upward-sloping trendline from September 2019 lows with a breach of neckline support in play since early November, bolstering the case for bearish reversal.

GBP/USD weekly chart created with TradingView
Zooming into the daily chart for a look at near-term technical levels, the next layer of support appears to be in the 1.2763-84 area. A daily close below that exposes former resistance at 1.2582 to a retest. Alternatively, a move back above rising trend line support-turned-resistance, now at 1.3004, sets the stage for another challenge of the 17-year downtrend. Its lower boundary is currently at 1.3197.
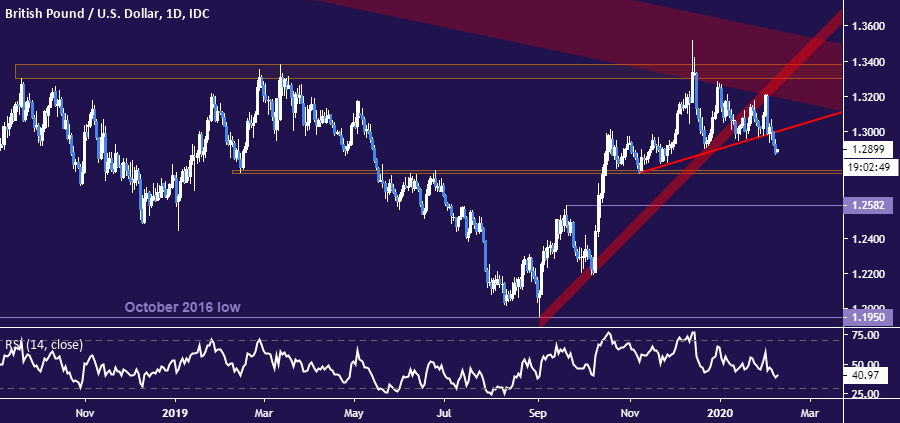
GBP/USD daily chart created with TradingView
GBP/USD TRADER SENTIMENT

Retail trader data shows 72.11% of traders are net-long with the ratio of traders long to short at 2.59 to 1. The number of traders net-long is 2.14% higher than yesterday and 28.79% higher from last week, while the number of traders net-short is 13.10% lower than yesterday and 33.73% lower from last week.
IG Client Sentiment (IGCS) is typically used as a contrarian indicator, and the fact traders are net-long suggests GBP/USD prices may continue to fall. In fact, traders are now more net-long than the prior trading session or versus a week ago. The combination of current sentiment and recent changes offers a stronger GBP/USD-bearish contrarian trading bias.
GBP/USD TRADING RESOURCES
- Just getting started? See our beginners’ guide for FX traders
- Having trouble with your strategy? Here’s the #1 mistake that traders make
- Join a free webinar and have your questions answered
--- Written by Ilya Spivak, Currency Strategist for DailyFX.com
To contact Ilya, use the comments section below or @IlyaSpivak on Twitter


