


GBP/USD Price Technical Analysis
- British Pound vs US Dollar chart highlights a continued sideways move
- GBP/USD breakout levels
GBP/USD Price – Bulls Pullback
Last week, Cable rallied to its highest level in over three weeks at 1.3209 then closed the weekly candlestick with 1.0% gain. However, this week the market has retreated from this level after some longs seemed to cut back.
Alongside that, the Relative Strength Index (RSI) dipped below 50 signaling a possible start of downtrend move.
GBP/USD DAILY PRICE CHART (April 25, 2018 – FEB 6, 2020) Zoomed out


GBP/USD DAILY PRICE CHART (SEP 20 – FEb 6, 2020) Zoomed IN

From the daily chart, we noticed that on Dec 23 GBP/USD corrected its uptrend move and created a lower low at 1.2904. Since then the price stuck in a sideways move, creating lower highs with higher lows.
On Monday, GBPUSD tumbled to a lower trading zone 1.2965 – 1.3048 then closed below the 50-day average generating two bearish signals. Yet the price failed again at clearing the stubborn support level marked on the chart, reflecting that bulls were not done yet.
A close above the high end of the zone may encourage bulls to push towards 1.3300 handle. Further close above this level could end current sideways move causing a rally towards 1.3515. In that scenario, the daily and weekly resistance area and levels marked on the chart (zoomed in) should be considered.
On the flip side, a close below the low end of the zone may lead some bulls to exit the market. This could lead GBPUSD towards 1.2774. Further close below this level opens the door for bears to press towards 1.2548. That said, the weekly support area and levels printed on the chart should be monitored.

GBP/USD Four Hour PRICE CHART (DEC 23 – FEB 6, 2020)
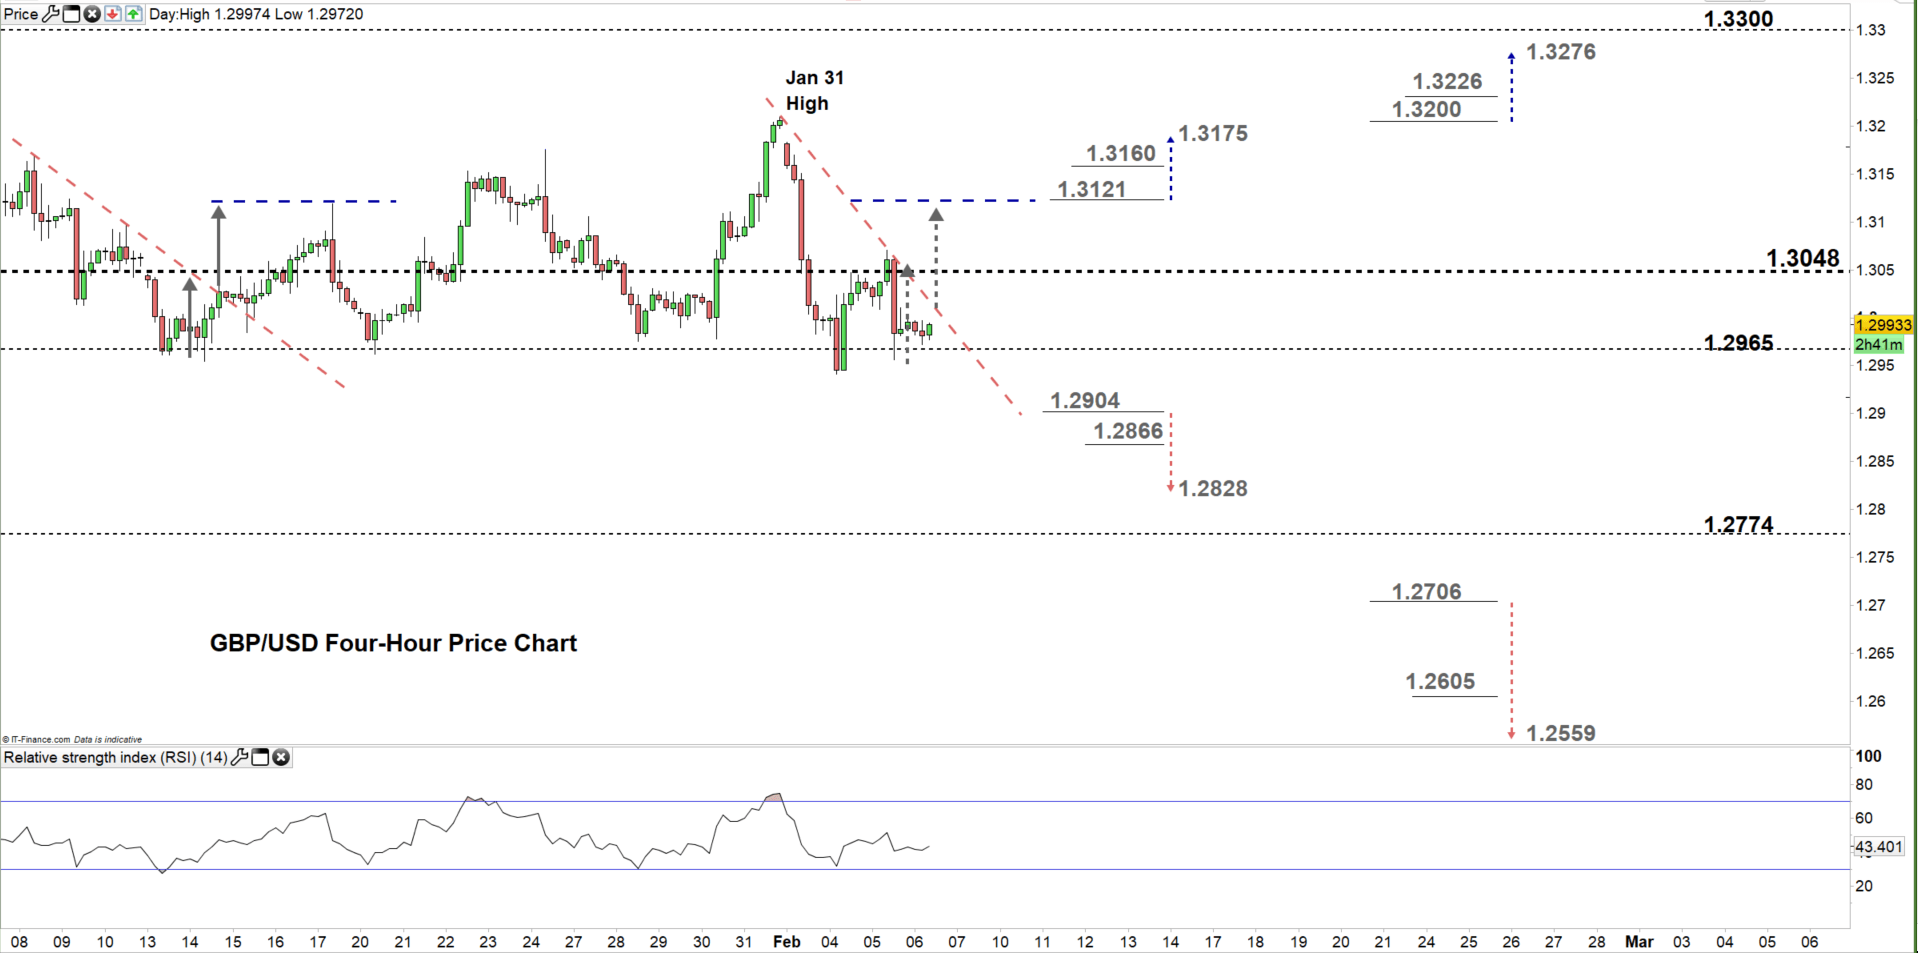
Looking at the four-hour chart, we notice on Tuesday Cable declined and printed 1.2941-its lowest level in six weeks. The market rallied after and continued its sideways move. Today, the price eyes a test of the downtrend line originated from the Jan 31 high at 1.3209.
A break above 1.3121 may cause a rally towards 1.3175. Although, the daily resistance underlined on the chart would be worth monitoring. In turn, any break below 1.2904 could send GBP/USD towards 1.2828. Nonetheless, the weekly support level underlined on the chart should be kept in focus.
See the chart to find out more about key levels Cable would encounter in a further bearish /bullish scenario.
Written By: Mahmoud Alkudsi
Please feel free to contact me on Twitter: @Malkudsi


